To better understand how dimensions in Anaplan map to a CSV output file, we've prepared an example to illustrate the mapping.
In this example, the Module Many Dimensions module has this view in Anaplan:
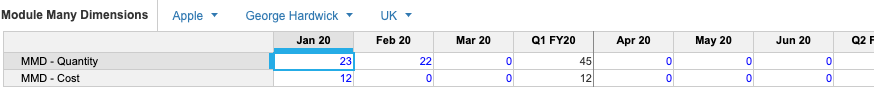
If you export CSV data using the Retrieve cell data for a view (/models/{modelId}/views/{viewId}/data) endpoint for this view, the resulting file contains a grid-style export format:
Apple,George Hardwick,UK

,Jan 20,Feb 20,Mar 20,Q1 FY20,Apr 20,May 20,Jun 20,Q2 FY20,Jul 20,Aug 20,Sep 20,Q3 FY20,Oct 20,Nov 20,Dec 20,Q4 FY20,FY20

MMD - Quantity,23,22,0,45,0,0,0,0,0,0,0,0,0,0,0,0,45

MMD - Cost,12,0,0,12,0,0,0,0,0,0,0,0,0,0,0,0,12
- The first line in the output file contains the chosen items for the page selectors.
- The second line is the column headers (showing the items of the time dimension).
- Subsequent lines contain the data for each line item.
To map this to data to an external system, you require metadata to provide information for the page selectors, columns, and rows. In Anaplan, you can view this in the Pivot display. The diagram below illustrates the mapping between the Pivot display and the CSV export.
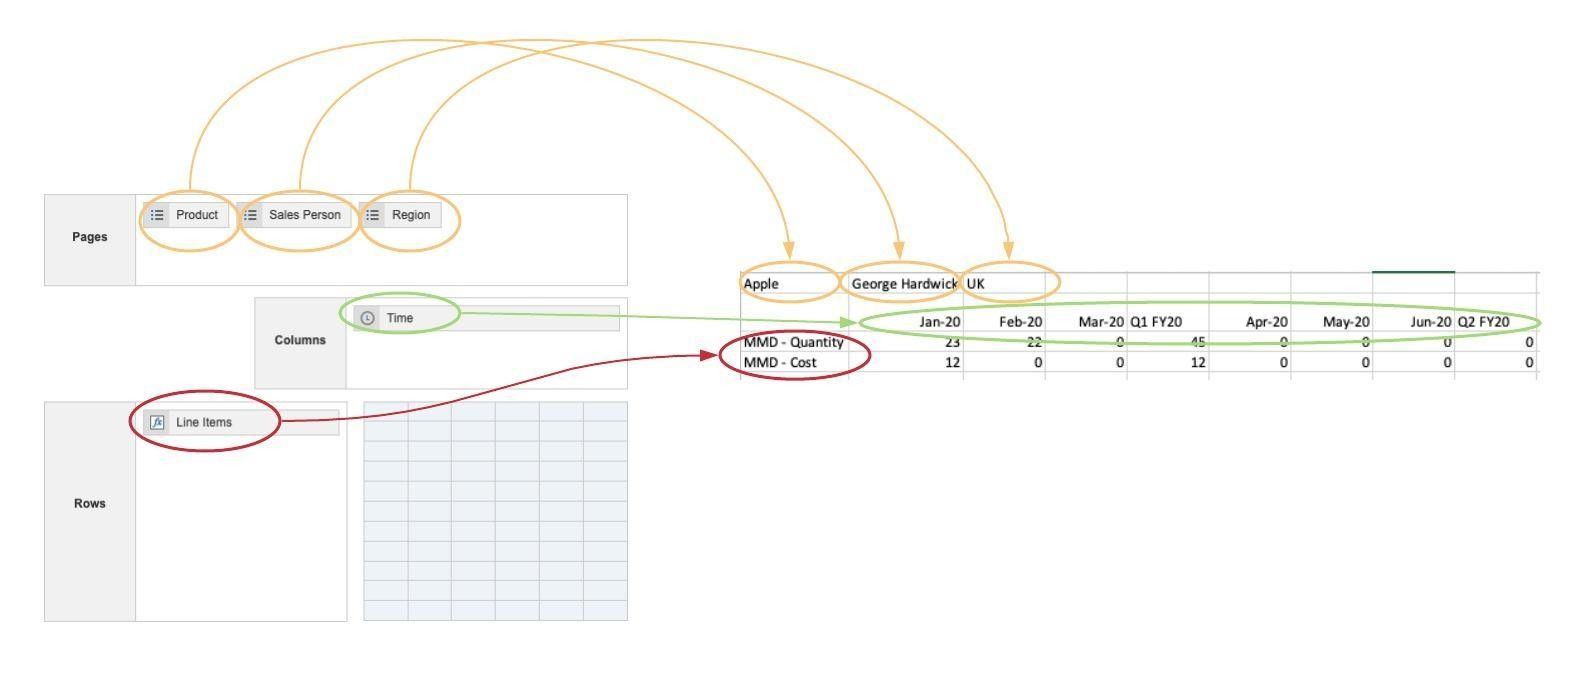
Use the Retrieve metadata for dimensions on a view (/models/{modelId}/views/{viewId}) endpoint to extract the information contained in the pivot.

