Learn about new Anaplan features and enhancements introduced in May 2026.
User Experience
New chart palette and grid theme
We've added a new system chart palette and grid theme that aligns with Anaplan brand colors. This ensures consistency across the platform and makes your charts look sharper. We've also upgraded the color picker for chart series, enabling you to easily select a series color from the predefined palettes.
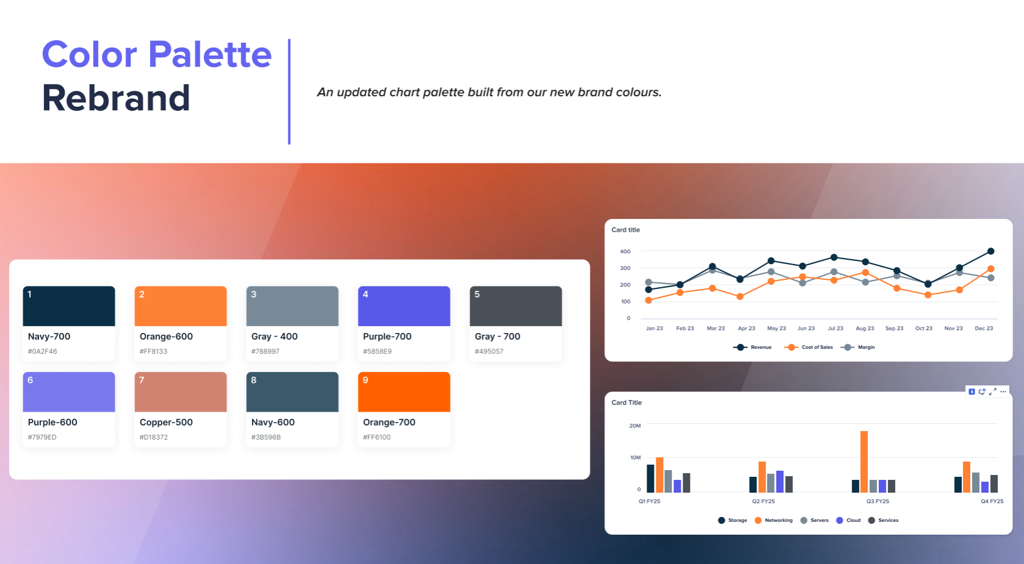
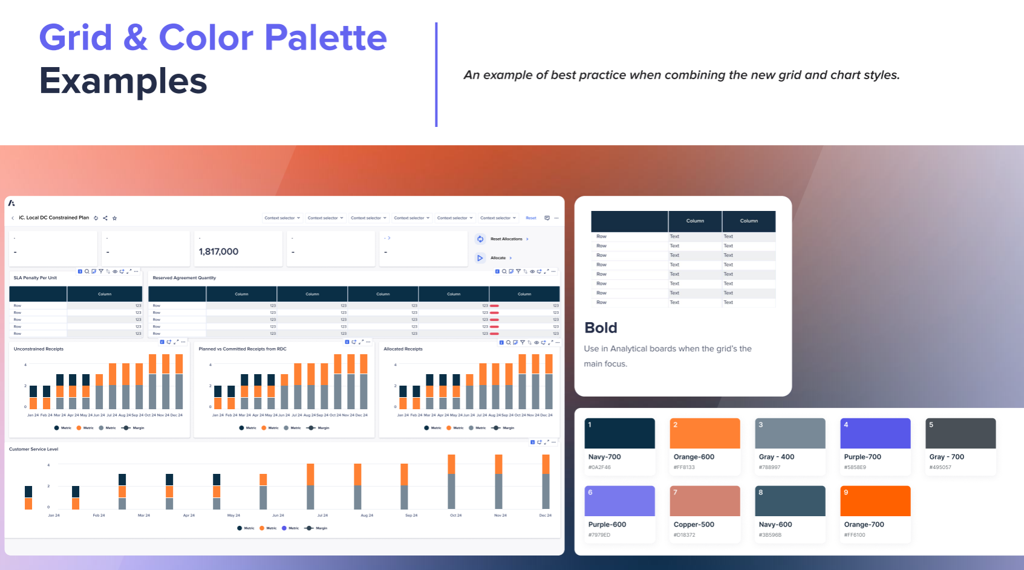
Learn more in Chart palettes
Hierarchy chart filter
We've added filtering capabilities to hierarchy charts. You can narrow down your data and focus on specific areas, viewing only the data that matches your selected filter criteria. Filters are user-specific and visible only to you. You can filter hierarchy data using any available line item, such as employee skill, tenure, or location, enabling a highly targeted view of your information.
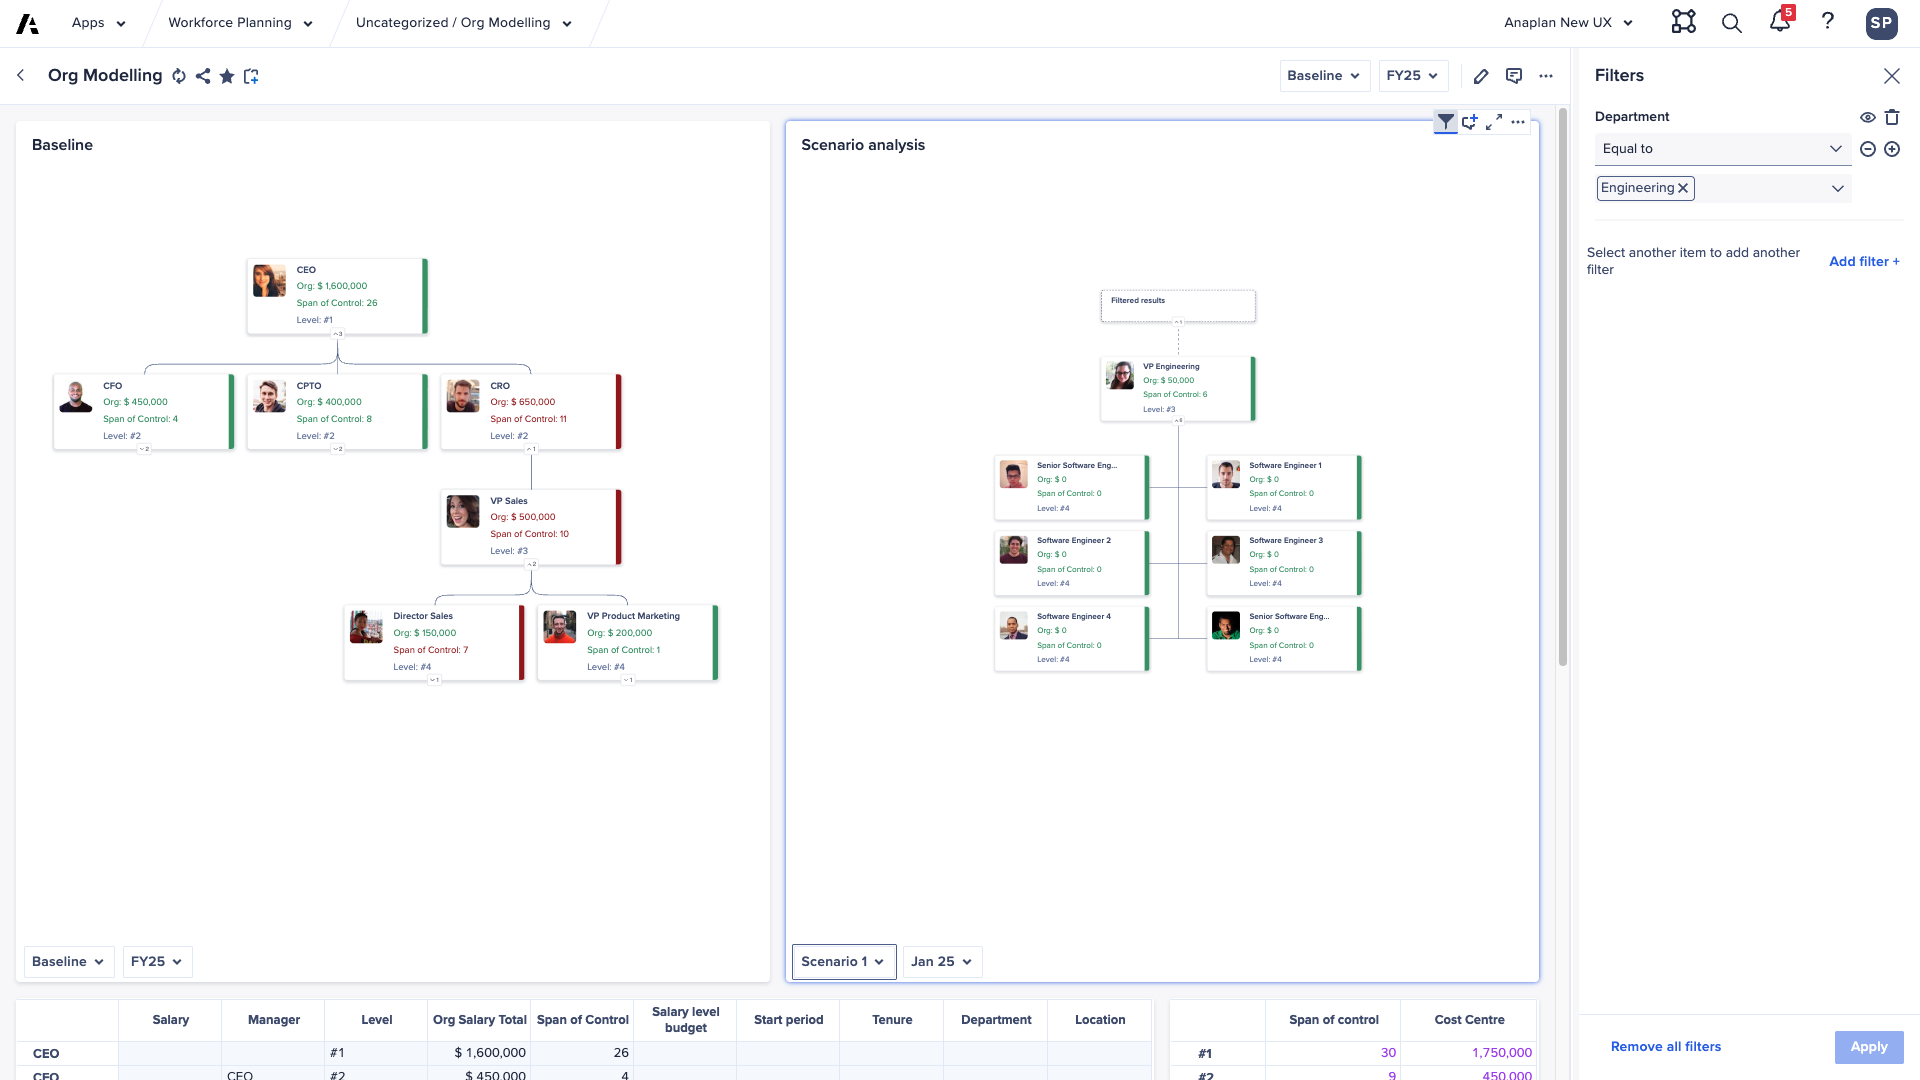
Learn more in Use hierarchy cards.
Polaris
We've introduced four new aggregation functions. Learn more here:
Optimizer
Use current solution option
The Optimizer dialog now includes a Use current solution checkbox. If selected, when an Optimizer solution is in effect, the next optimization will use it as a starting recommendation. This can reduce the time it takes to find a solution. This is especially useful for sequential decision problems where the demand or data won't change much, or when you have a strong initial solution.
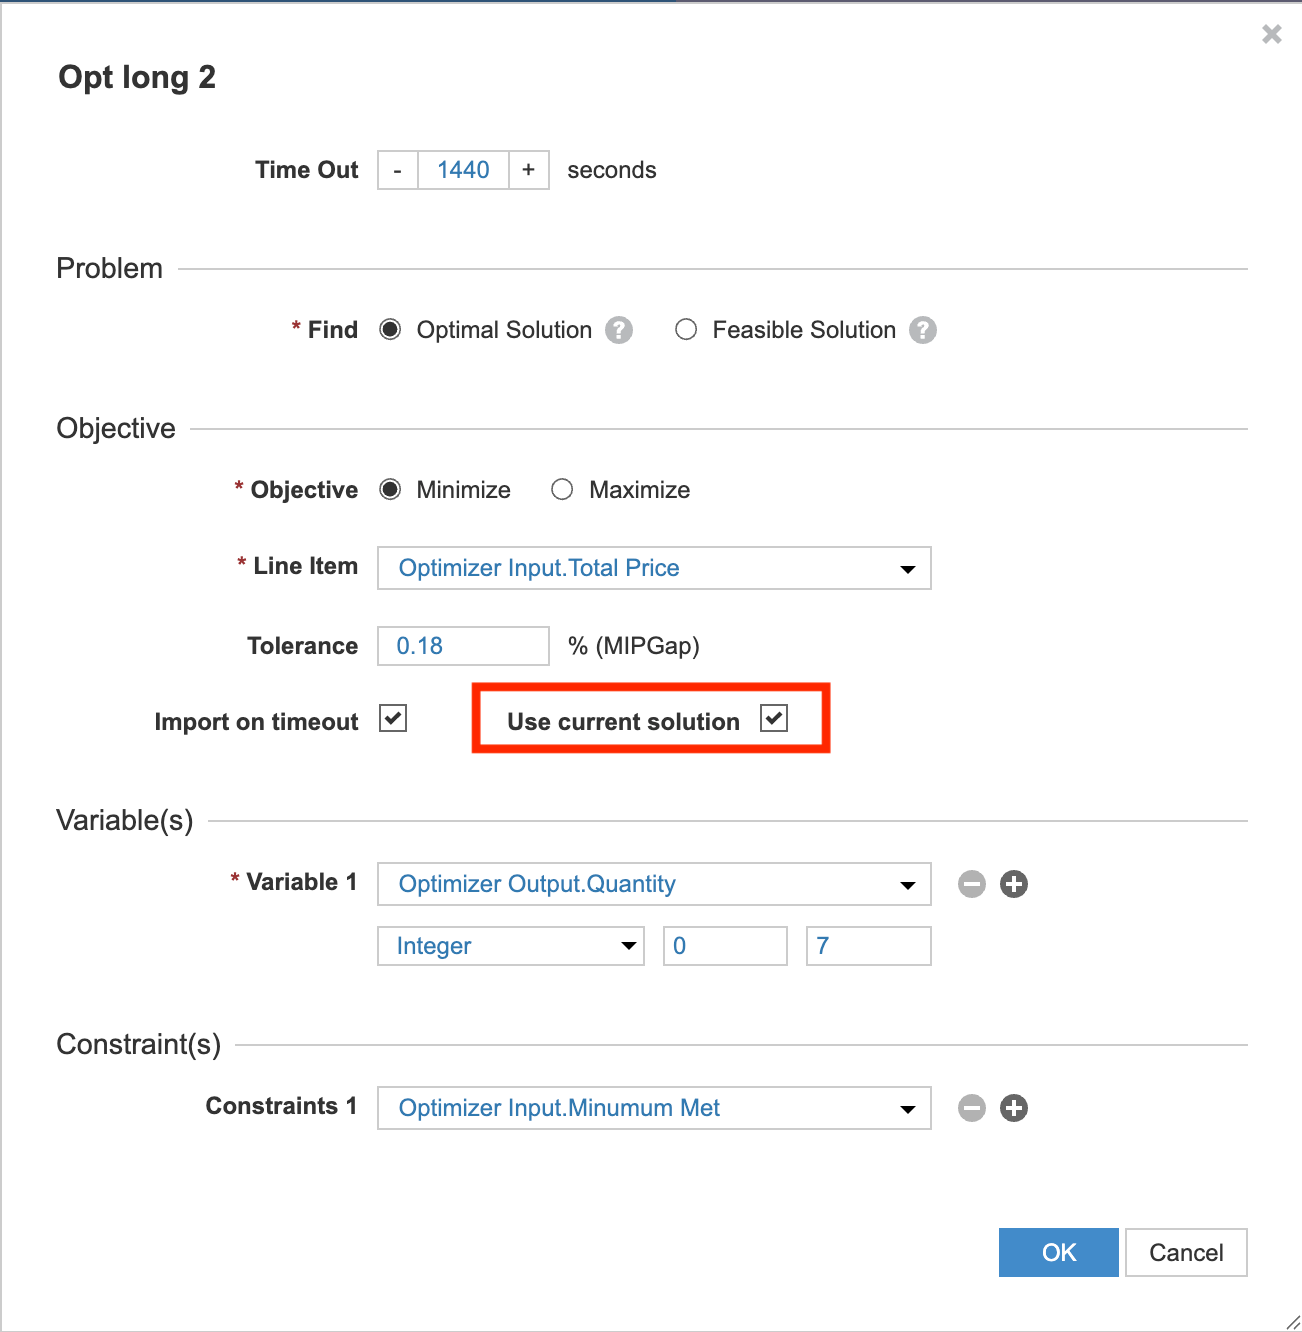
Learn more in Enable and use Optimizer.
Security and tenant administration
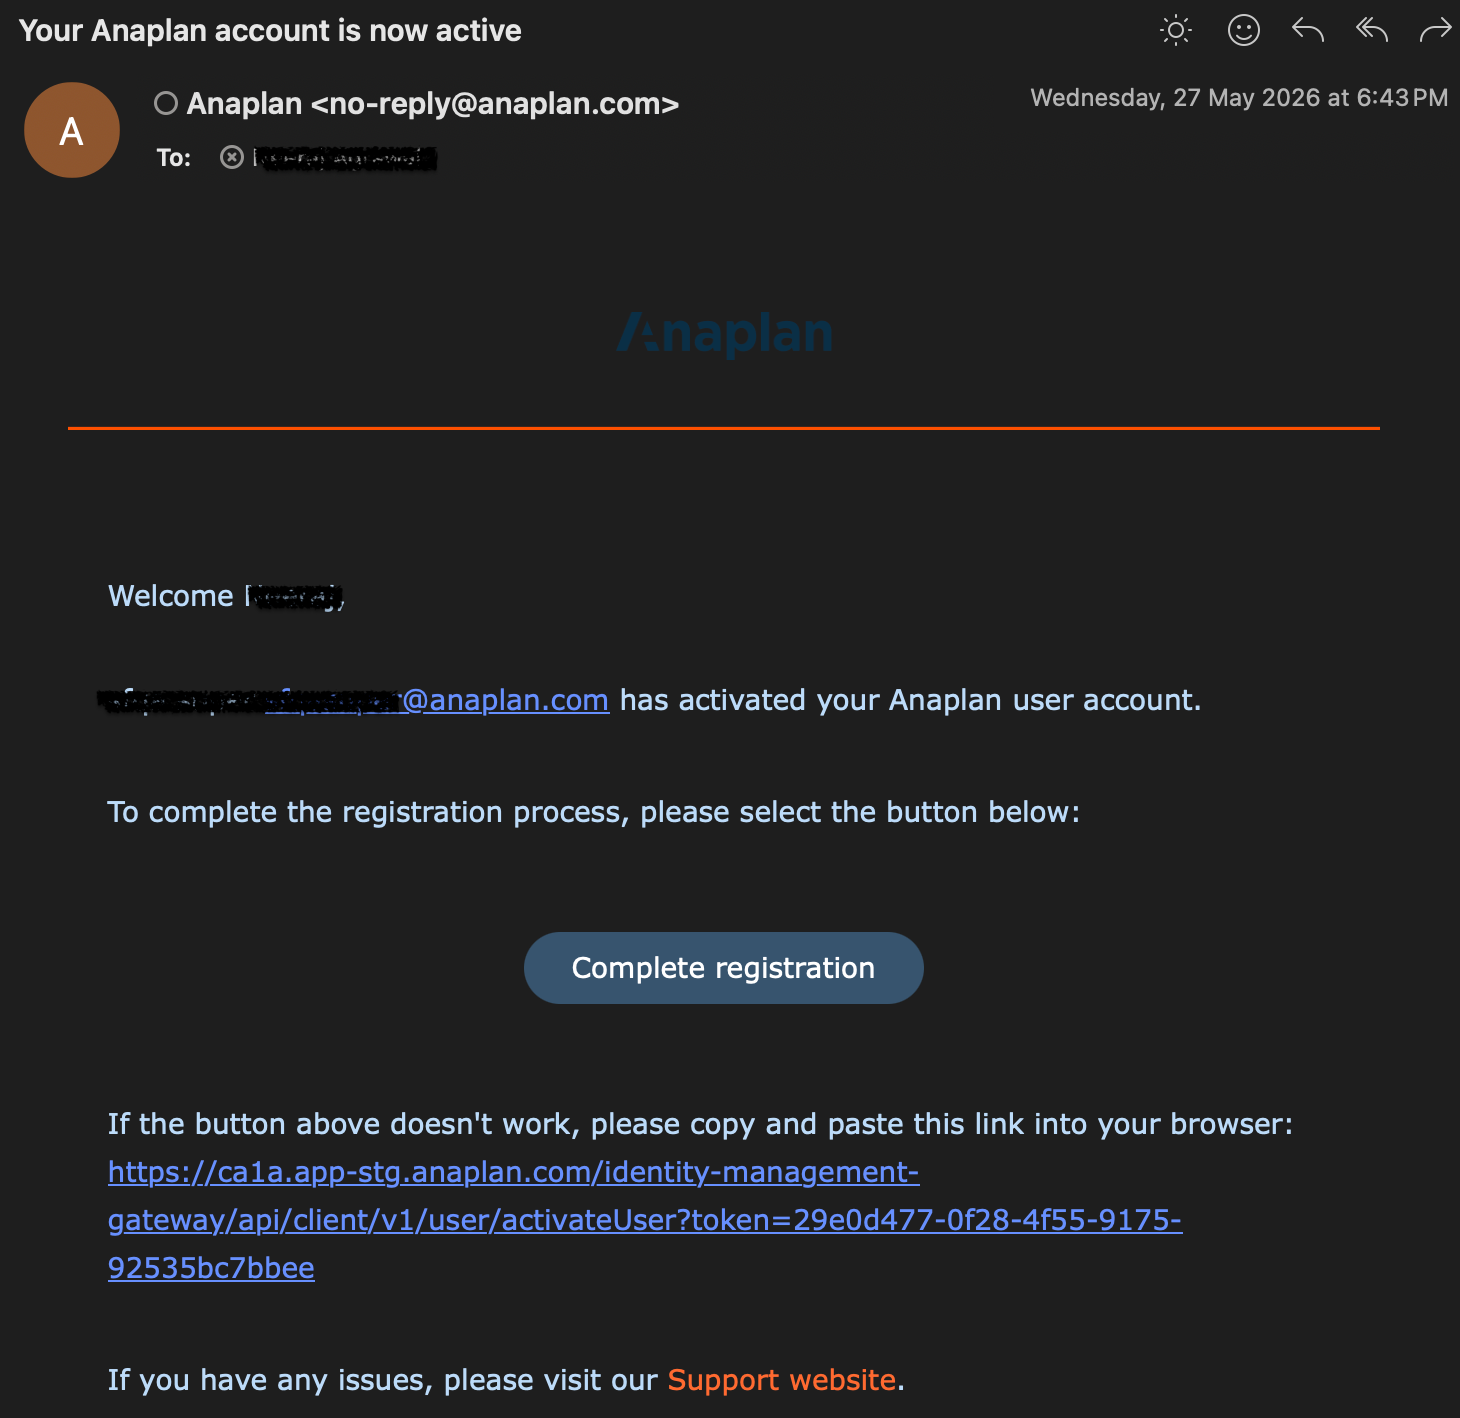
Enhancements to new user activation emails
To maintain a modern and secure user experience, we've updated the system-generated activation emails sent to newly provisioned users. The email templates for both Single Sign-On (SSO) and basic login configurations now have a refreshed, streamlined format that provides clear onboarding instructions tailored to your organization's tenant authentication preferences.
Single Sign-On (SSO) Activation: sent to users belonging to tenants using corporate identity provider authentication.
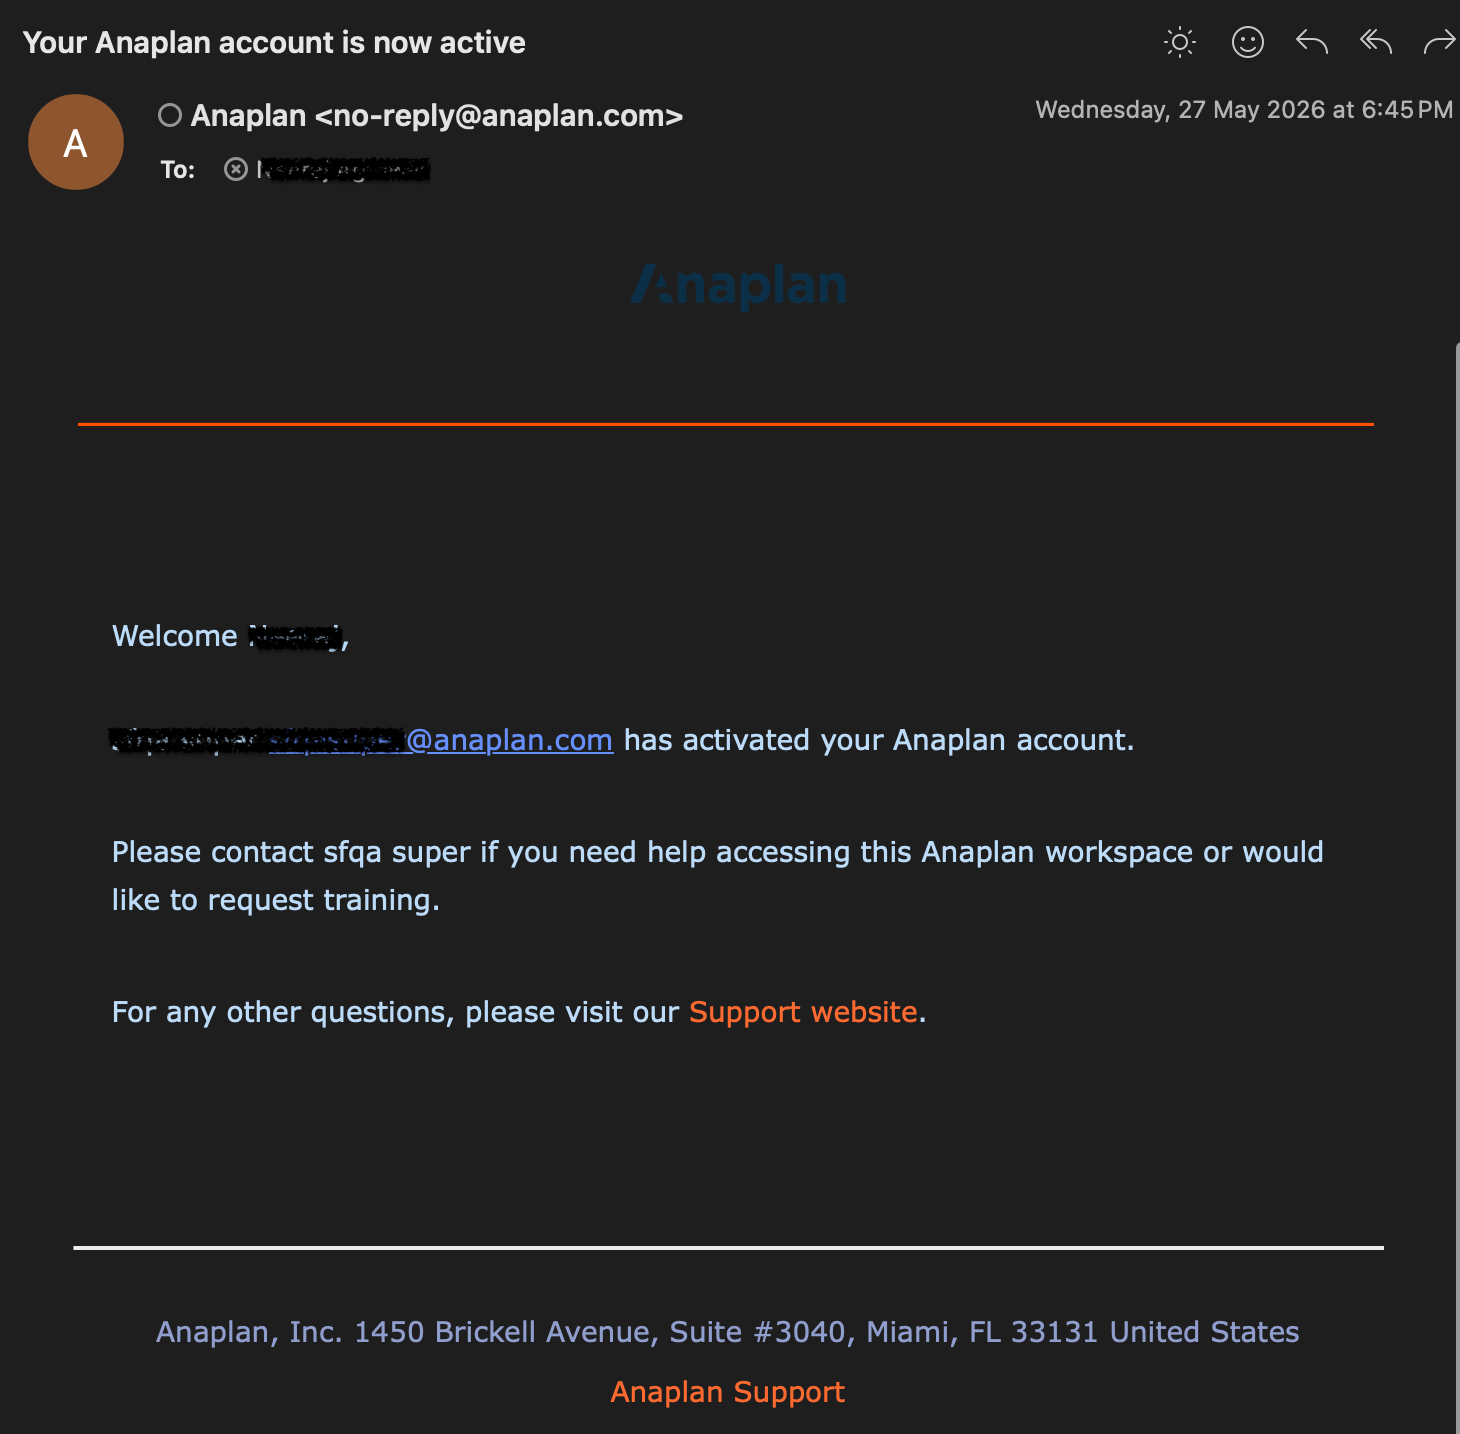
Basic Login Activation: sent to users using standard email and password authentication.
Forecaster
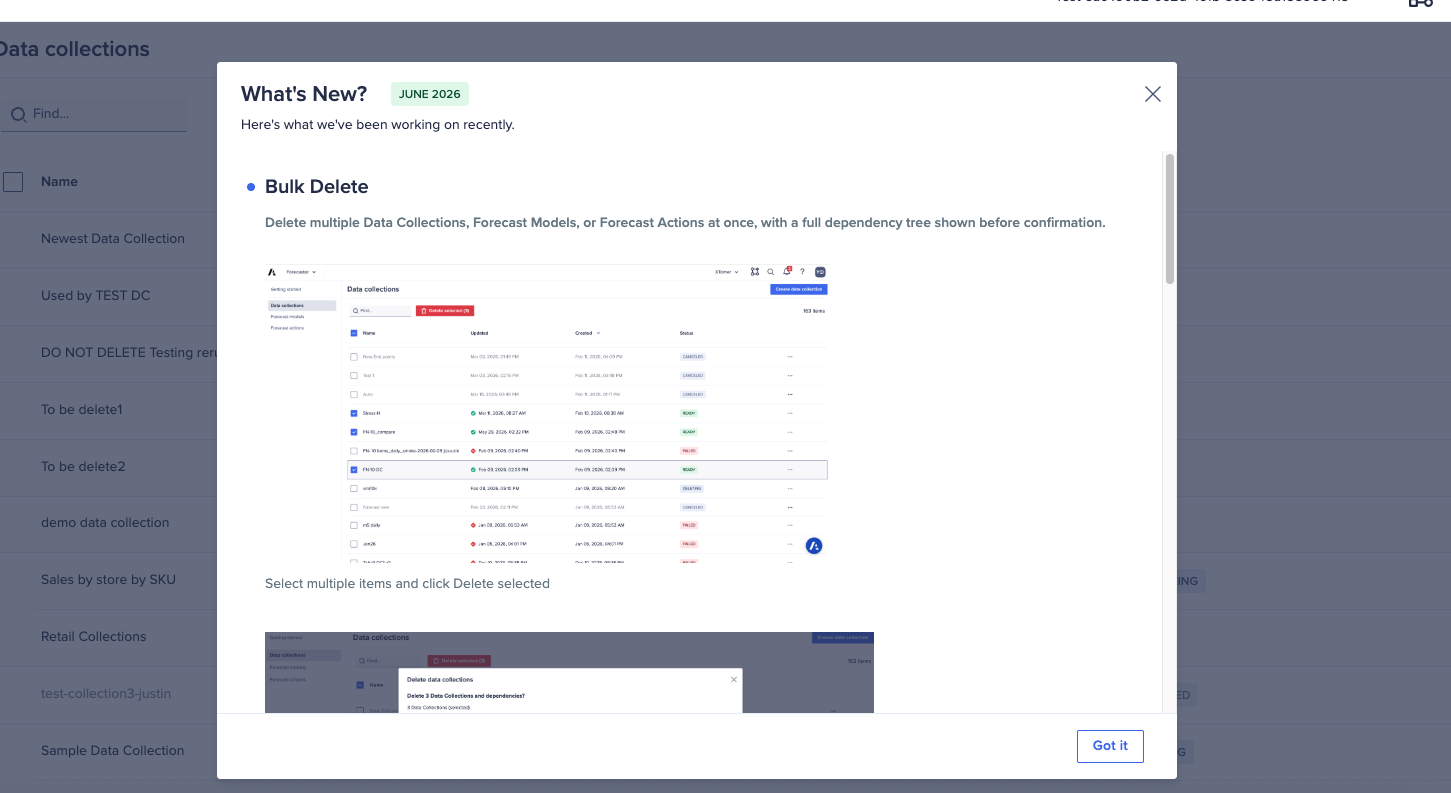
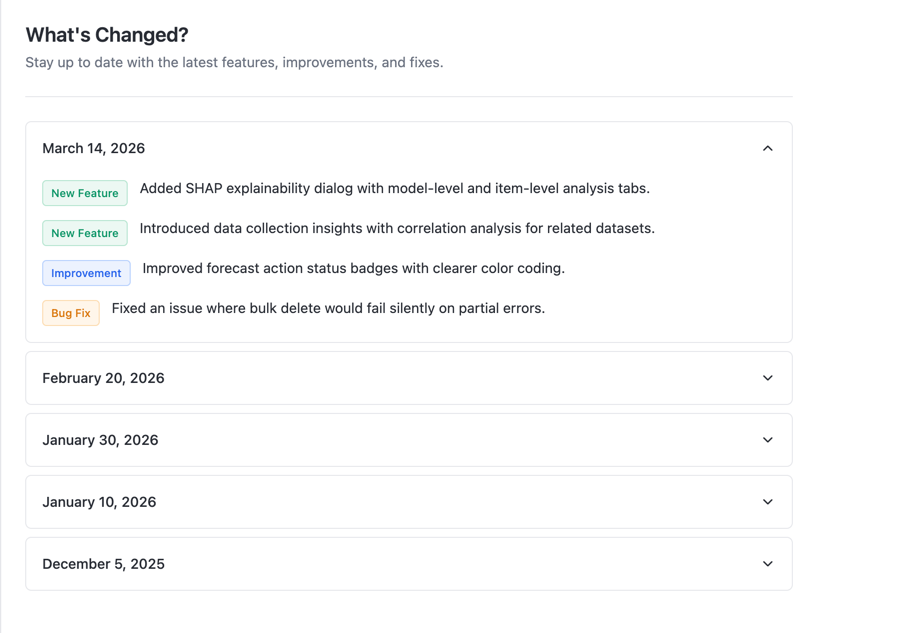
What's New panel
Stay up-to-date directly within the platform. We've added an in-app window that surfaces the latest Forecaster features, improvements, and fixes with every release.
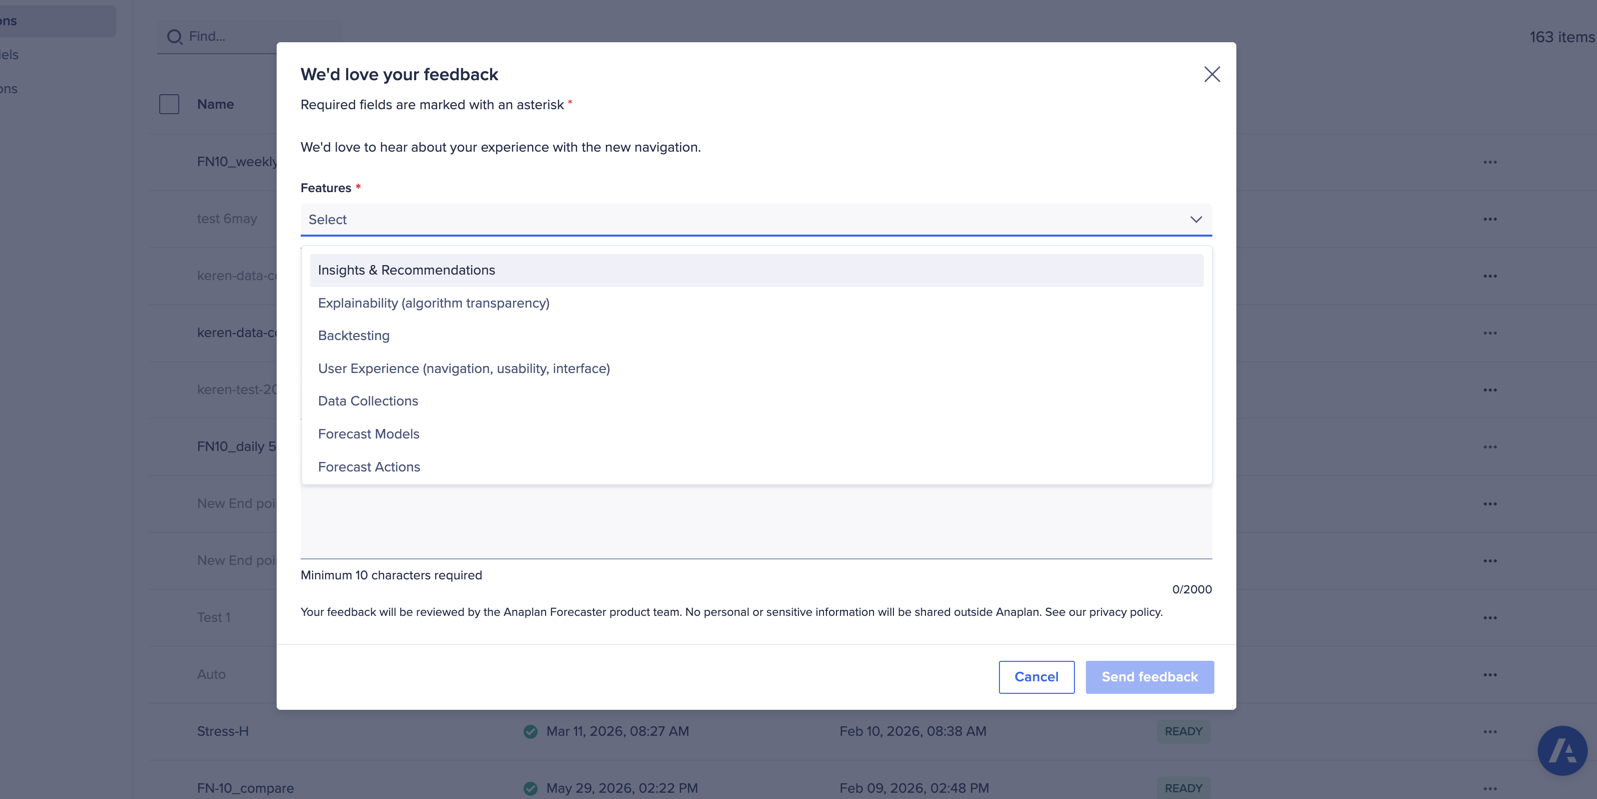
User feedback collector
You can now share in-app feedback on specific Forecaster feature areas directly with our product team.
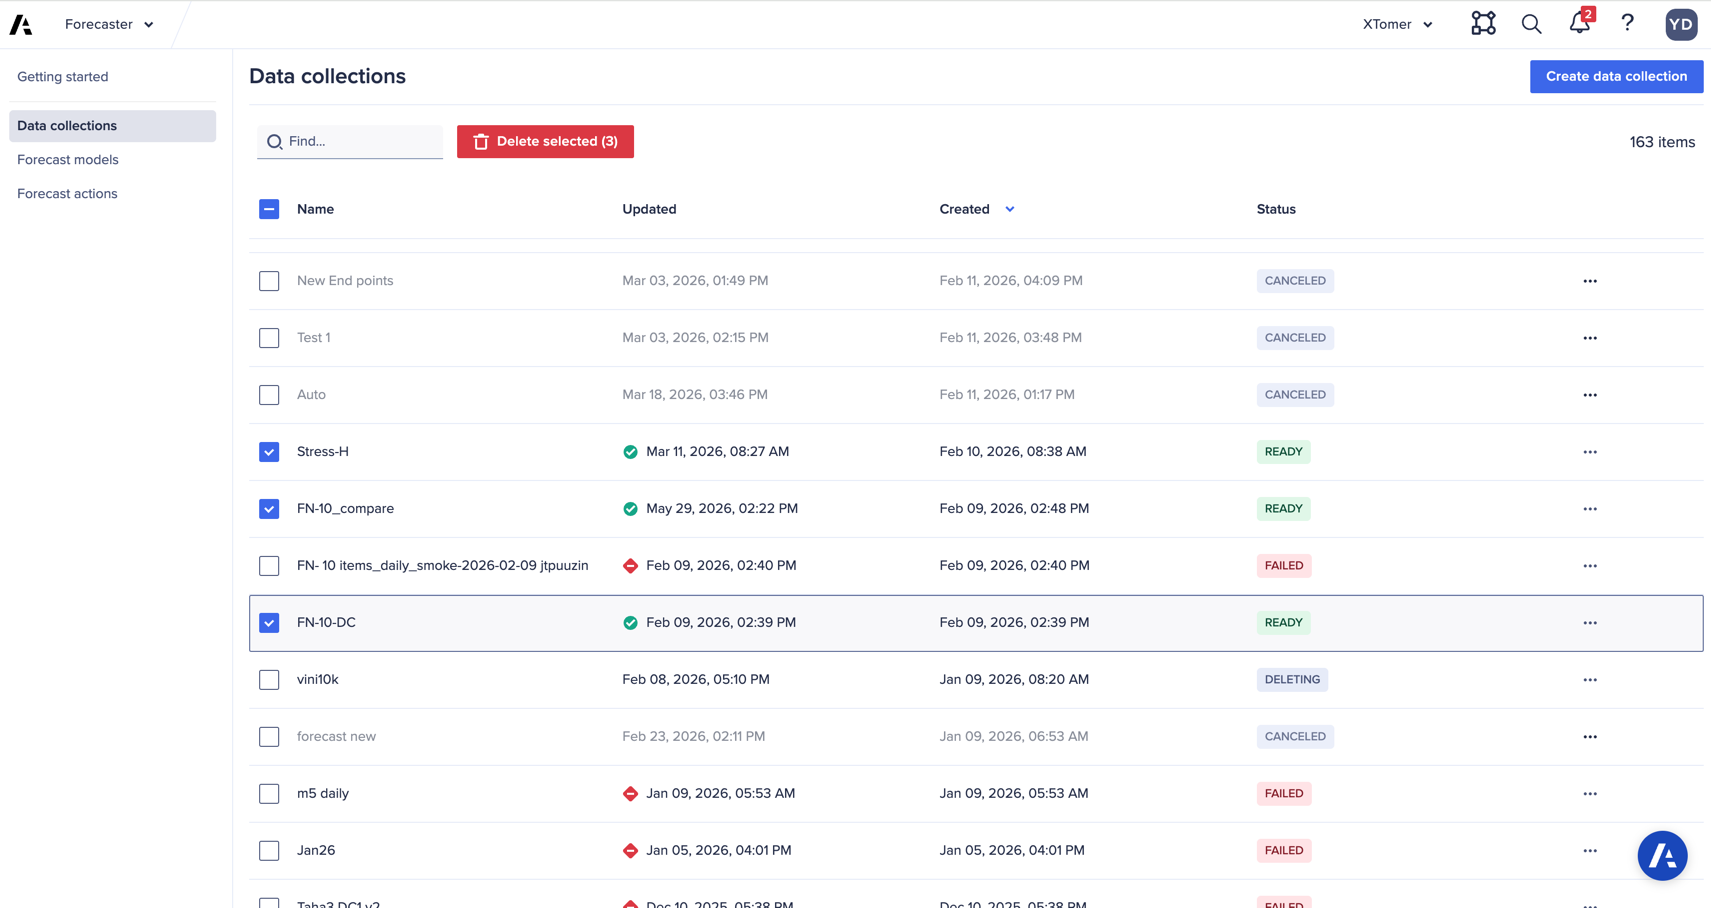
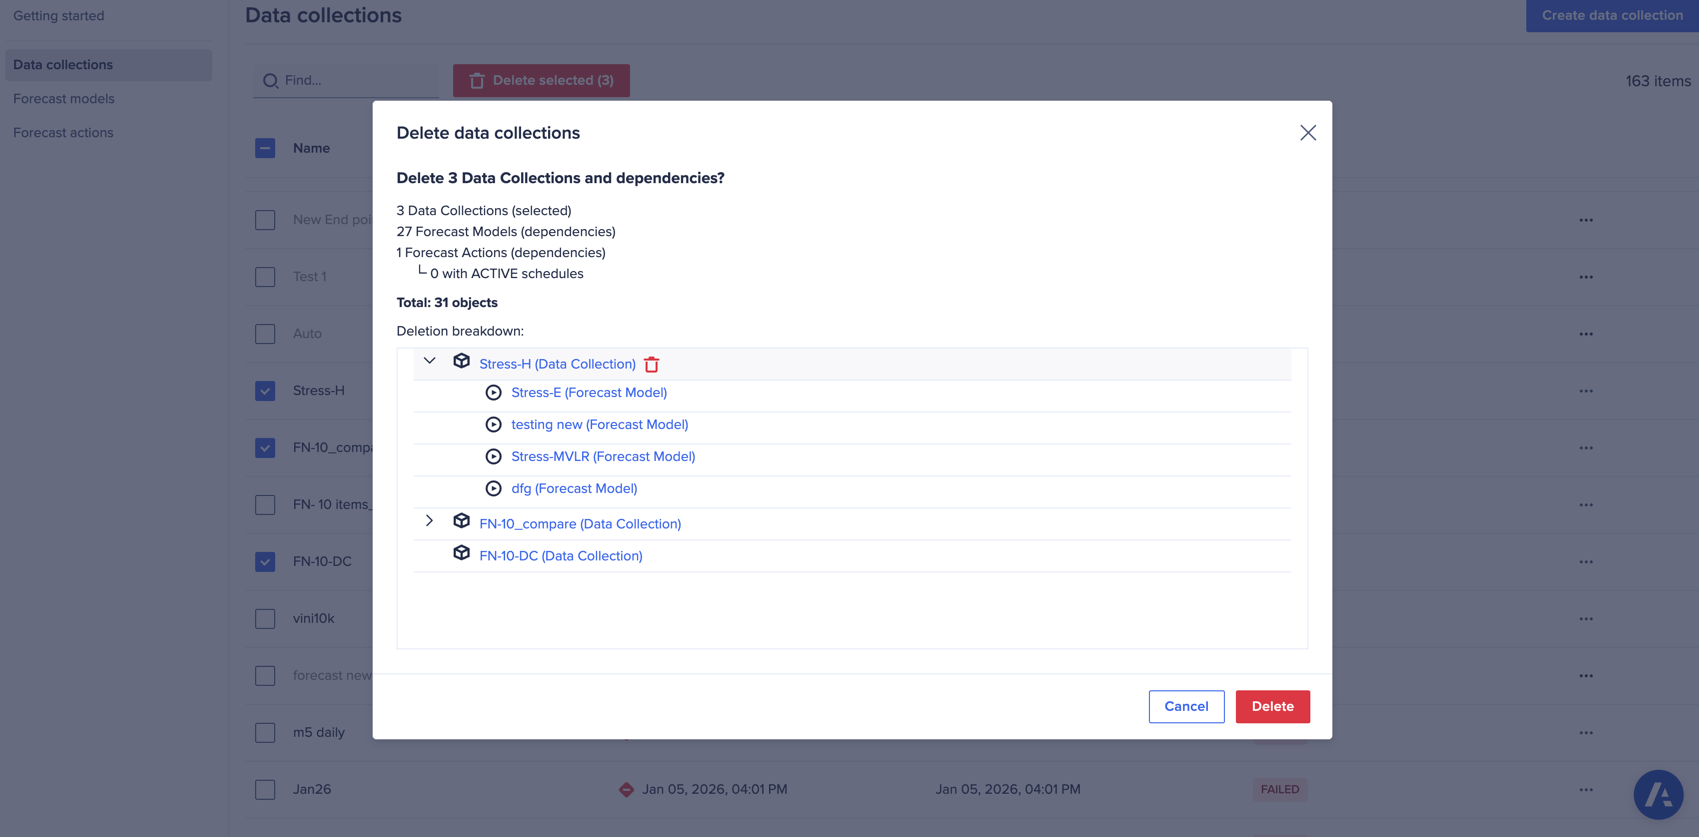
Bulk delete
You can now delete multiple data collections, forecast models, or forecast actions at once. A full dependency tree is displayed before confirmation to ensure safe deletions.
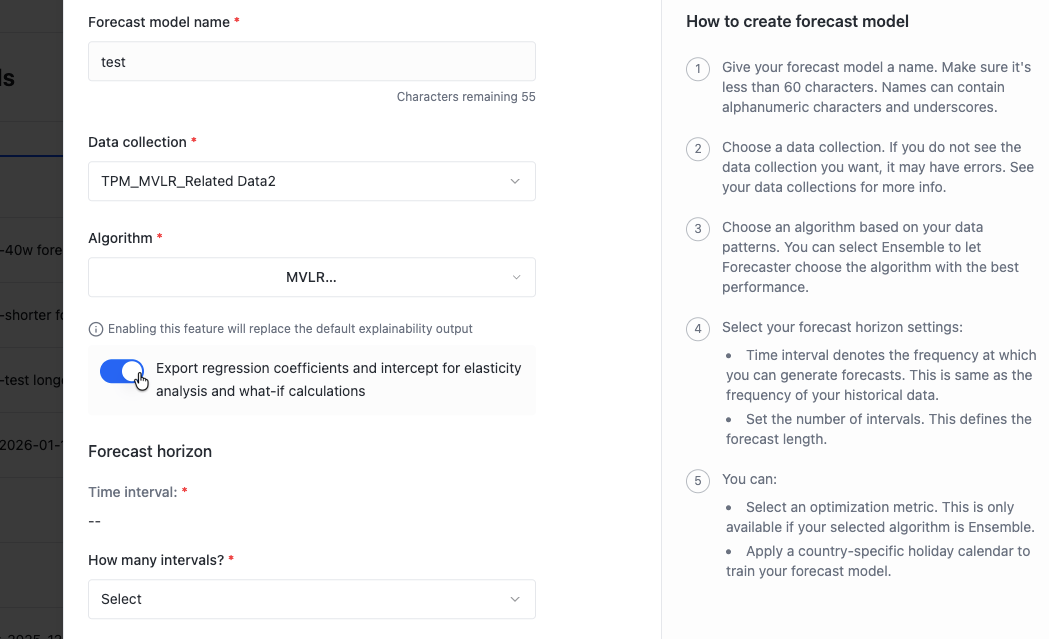
Sending raw coefficients and intercepts to Anaplan
Note: This feature is only available by request, as it replaces the standard explainability output.
Coefficient export enables advanced analytical use cases, particularly in Trade Promotion Management (TPM), where elasticity coefficients are essential for calculating promotional lift. Outputs include the Coefficient (β) (relationship between driver and outcome), the Intercept (α) (baseline value), and Price Elasticity metrics.
- Coefficient (β): The mathematical multiplier that quantifies the relationship between a driver (independent variable) and the outcome (dependent variable). It tells you: "For every 1-unit change in X, the outcome Y changes by β units."
- Intercept (α): The baseline value of your outcome when all drivers equal zero. Think of it as the "starting point" before any promotional activity occurs.
- Price Elasticity: A specific type of coefficient that measures how sensitive demand (sales) is to price changes. It answers: "If I change price by 1%, how much does demand change?"
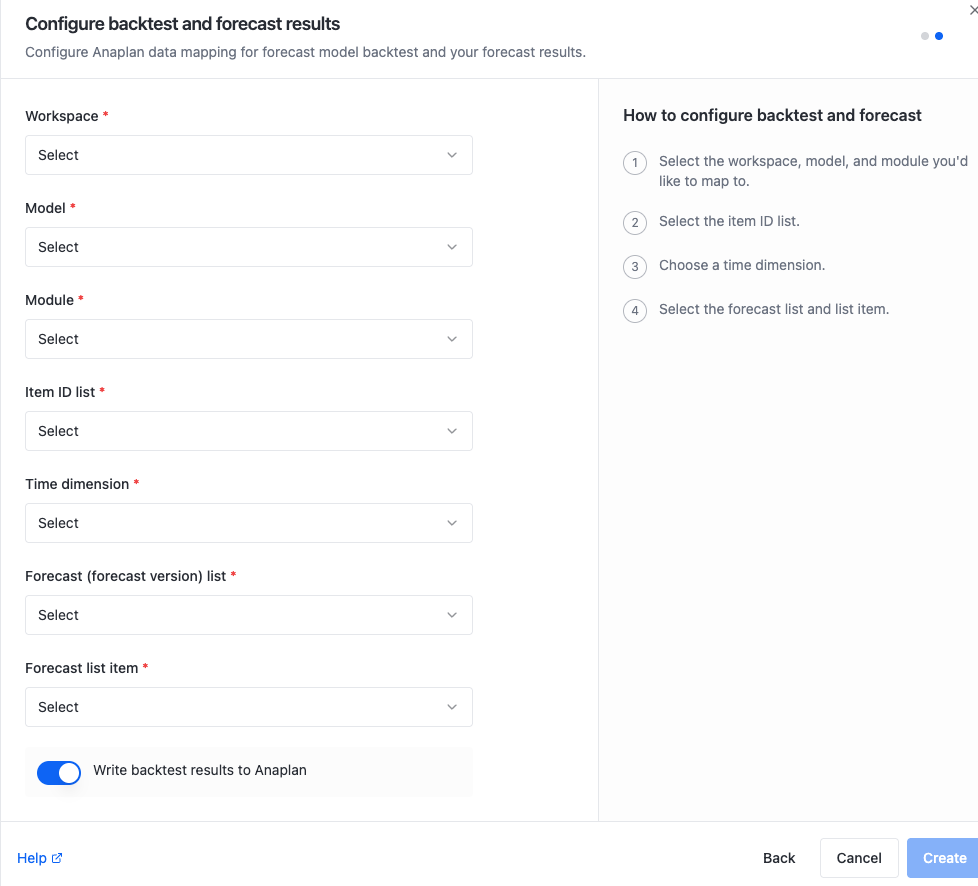
Backtest data write toggle
To save space and processing time, writing backtest results to Anaplan is now optional. This toggle is turned off by default.
Anaplan XL (version 2605.1)
General enhancements
- We've improved workbook health and guidance, writeback reliability, reporting on Anaplan and Financial Consolidation & Reporting, freeform reporting, and charts. We've also strengthened security and feature management.
- You now get clearer warnings before performance or support issues, fewer silent writeback failures, and more consistent behavior between Microsoft Excel desktop and web.
- We expanded our in-product guidance when workbooks drift from recommended limits. Messages appear in the Messages pane (or when adding connections), so users can act before slow opens, failed writes, or version mismatches.
- You can now use Exclude from display to hide members from reports without rebuilding models in Financial Consolidation & Reporting grids.

