Explainability data helps better understand the underlying drivers of a Forecast model.
Explainability results derive from underlying features of Forecast Model algorithms. These features help generate more accurate forecasts. Explainability results give an idea about the direction and relative magnitude of influence a given feature has on the forecast result. Not all features will impact forecast results in the same way across different data sets, time periods, and algorithm configurations.
Explainability feature types
Two types of features can be generated from an input data collection:
- Historical data features: For the historical data in your data collection, Forecaster algorithms automatically generate underlying features based on seasonality and trend. If you select the Forecaster built-in holiday calendar, features are automatically generated based on the calendar.
- Related data features: If you provide related data as part of the data collection, the features themselves and the lags of those features over time may be selected by the algorithm. Some examples include promotions and inventory.
If Forecaster determines a feature contributes significantly to the performance of a given algorithm, it's added automatically to the Forecast Feature Names list in the explainability results module.
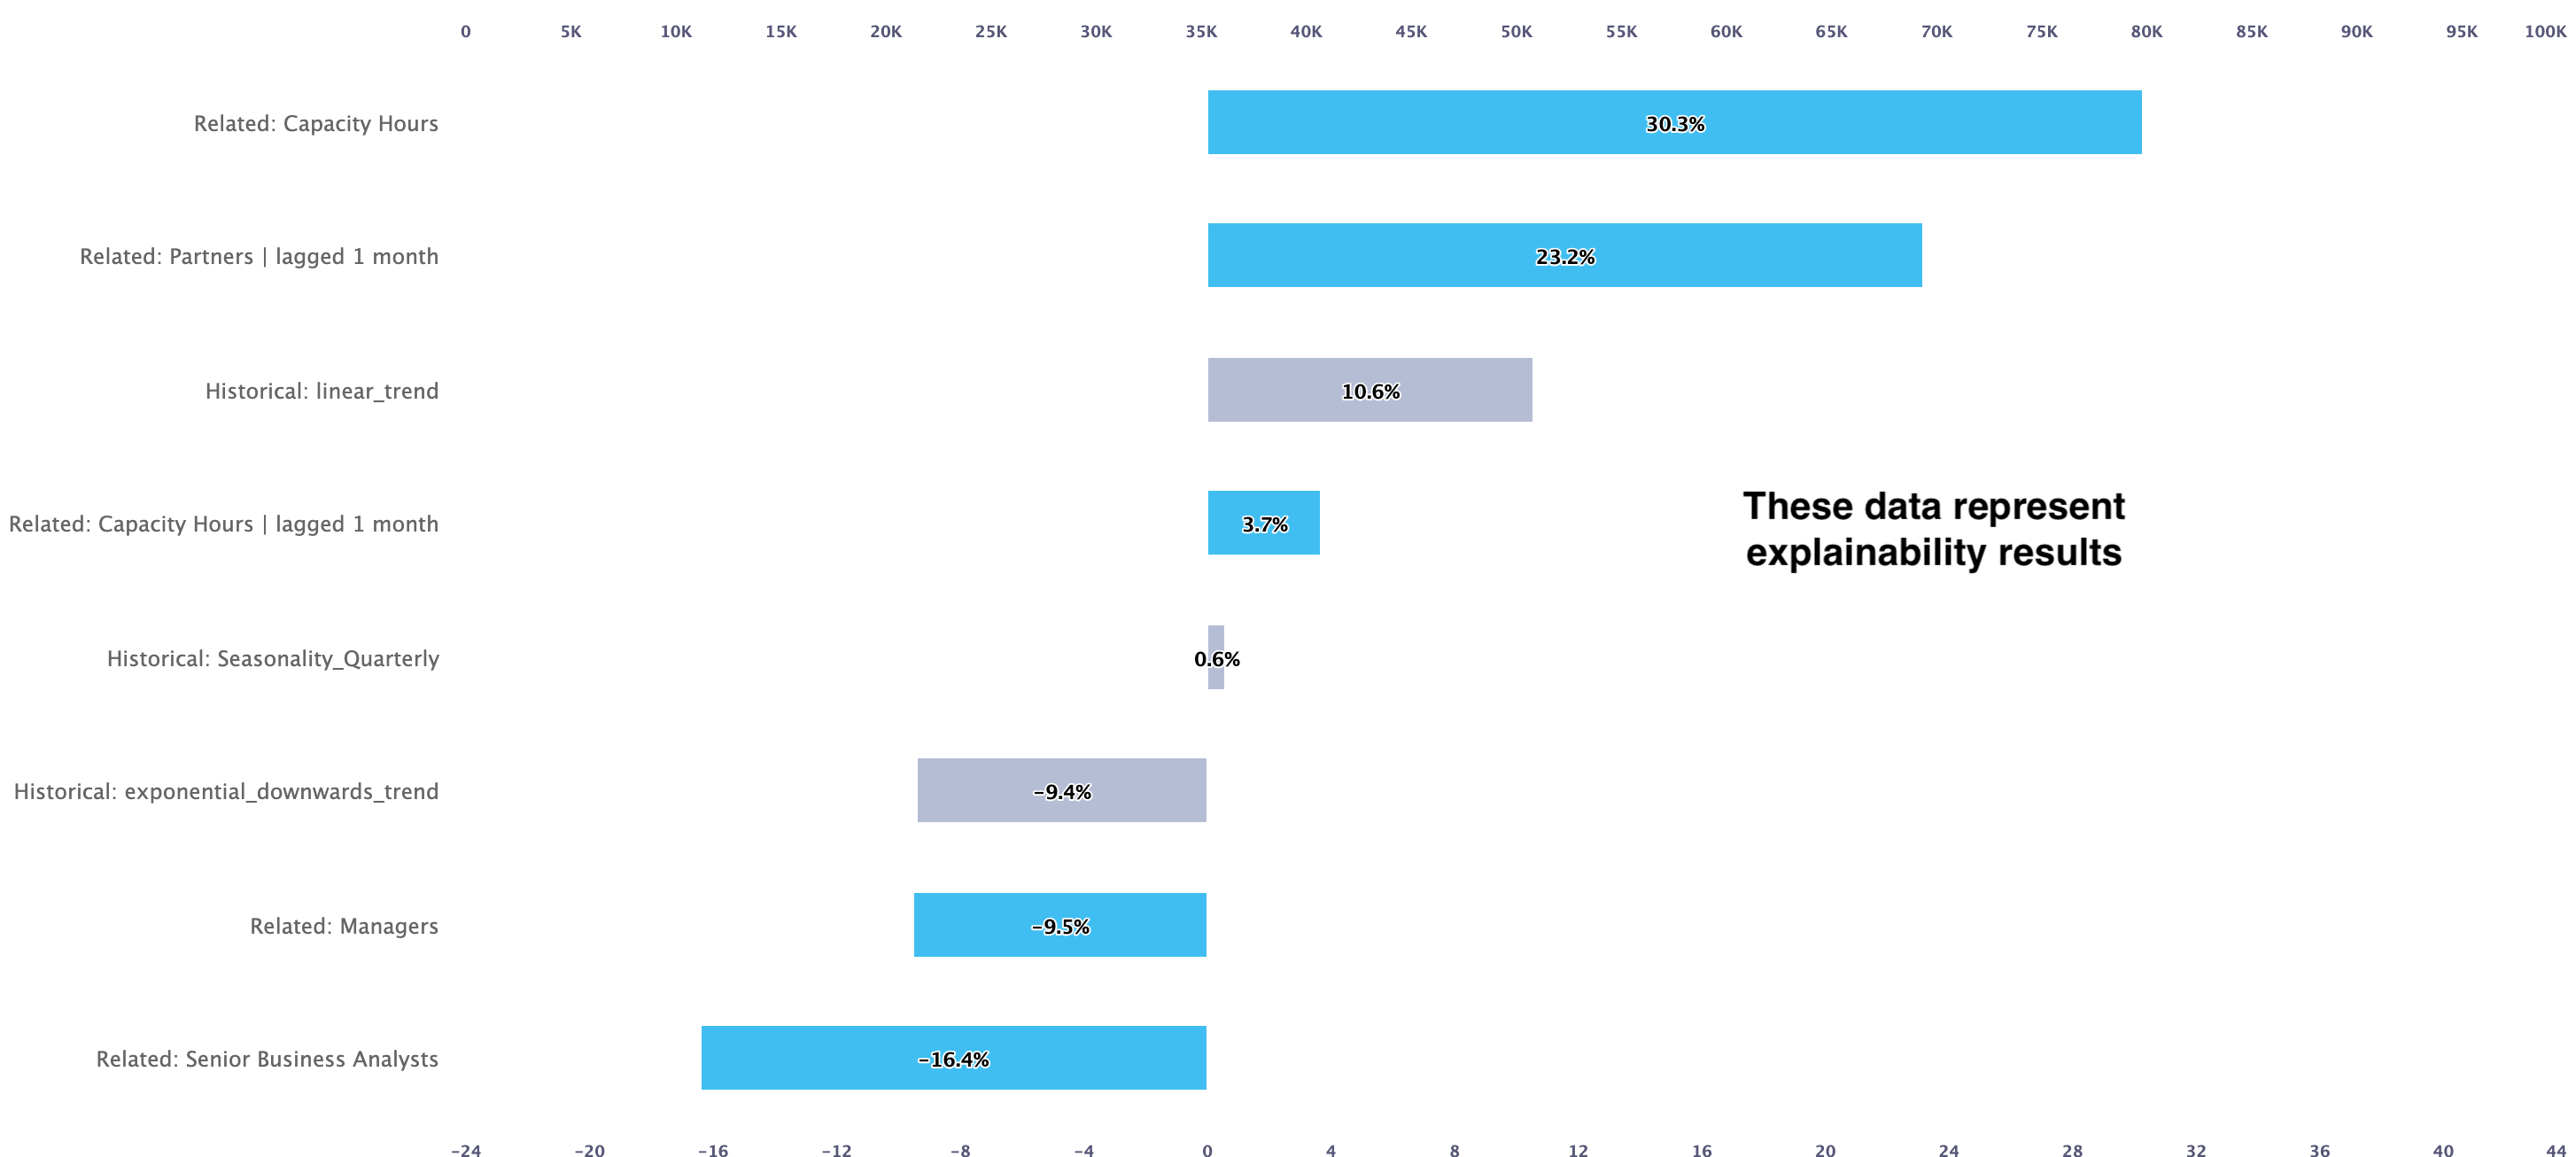
Explainability example
Take a Forecaster data collection with information on historical oil prices, e-bike prices, and promotion data. With explainability, you can show whether increased oil prices or promotions have a relatively greater impact on sales.
Feature impact on forecast results
See below to review the impact of features on forecast results.