Explainability details are included in the Amazon Ensemble, Anaplan Prophet, and MVLR algorithms.
- Explainability details pinpoint the relative impact of the forecast inputs (such as related data) on prediction results. Take, for example, an electric bike company:
- You can load a PlanIQ forecast model with information on historical oil prices, e-bike prices, and promotion data.
- You can show whether increased oil prices or promotions have a greater sales impact.
- Explainability details are derived from independent feature variables within algorithms. These details help to make predictions about the future. Common feature examples are:
- Marketing campaigns and promotions
- Inventory levels
- Crude oil prices
- Not all features impact prediction results in the same way. The feature contribution provides an idea about the degree of influence a single feature has on a prediction result.
The impact of features on forecast results
The chart below displays the impact of features on forecast results.
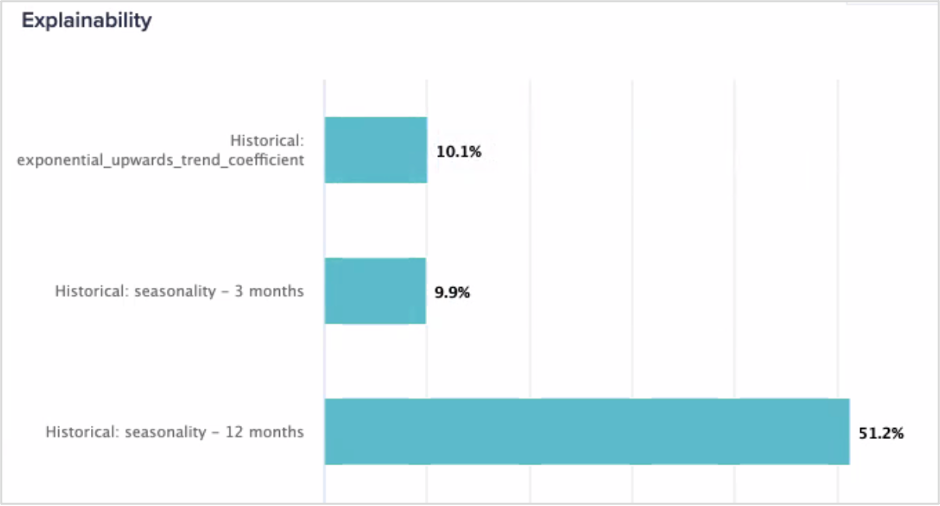
You can see that 12-month seasonality has a much greater impact than historical trend or 3-month seasonality, which have similar impacts.

