The tabular designer allows you to automatically create table reports against Analysis Services cubes in the DAX language. These are simpler to create than a grid, and can run against In-Memory or DirectQuery cubes. (Grids can't query DirectQuery Cubes.)
Report layout
The tabular report designer is split into three parts.
- Database browser, which enable you to see the tables, columns, and measures which exist.
- Report layout section, where you can specify the columns and measures on filters and in the table.
- Criteria area, here you can select the members retrieved, and filter the rows based on measure values.
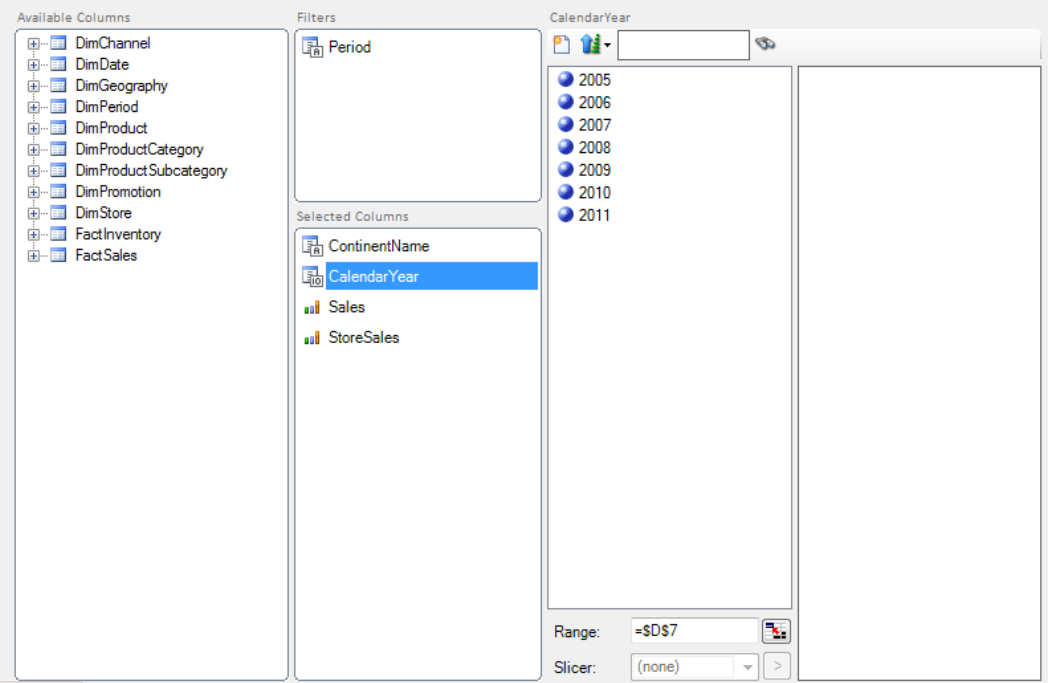
By dragging columns or measures into the Filters and Selected Columns areas, you can specify the table layout.
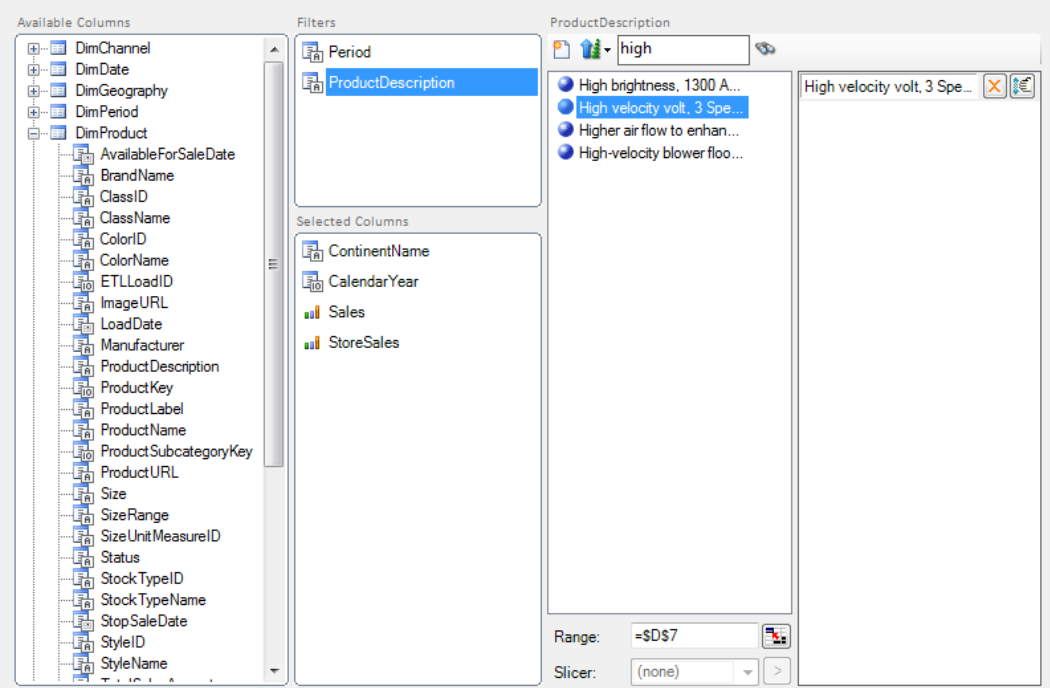
Member filters
When selecting a column, you can select only to return rows for specific members.
To select a member, drag it from the left to the right panel. You can also add selections based on Excel cells and Anaplan XL Reporting Slicers.
If you have a lot of values in the columns, you can use the search box to find members you are interested in.
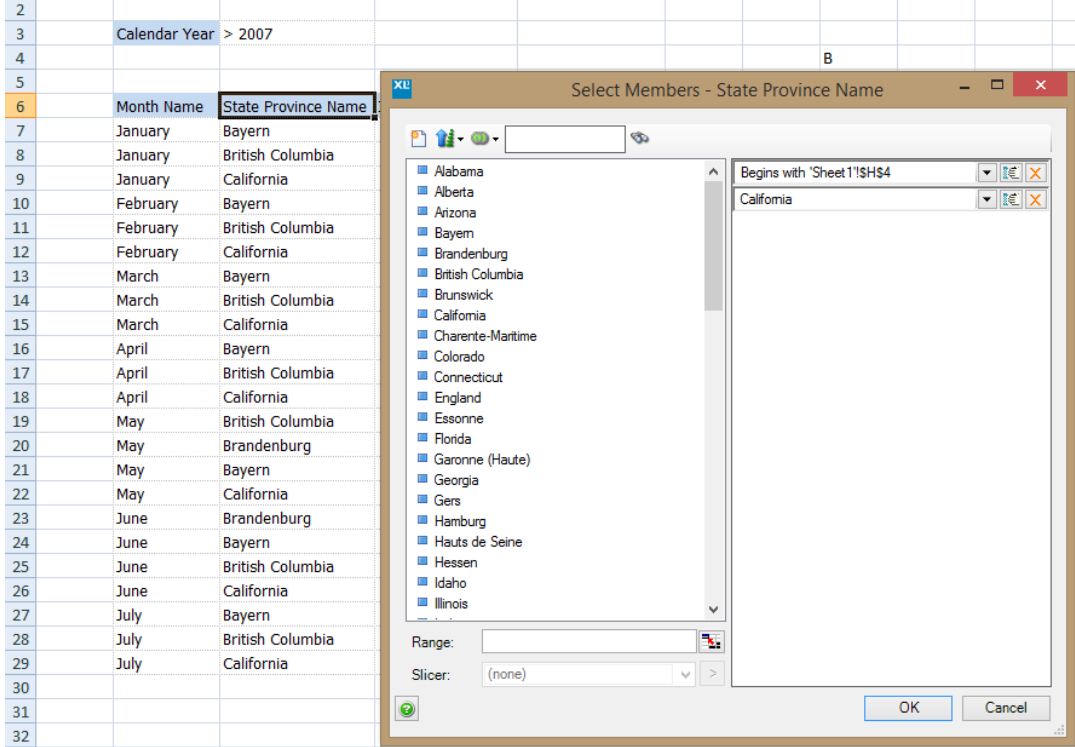
Advanced filters
You can add more complex filters to member selections. Using the dropdown you can select comparison options such as >, <, <>, among others.
For text columns, you also get options for Begins with, contains and others.
Additionally, using the dropdown in the toolbar you can choose whether conditions are combined using Or or And logic. "And" is useful for creating a between selection, for example, Year > 2010 and Year < 2015.
Measure filters
If you select a measure, you can add a filter to include only values that fit the criteria you want. These can come from an Excel cell if required.
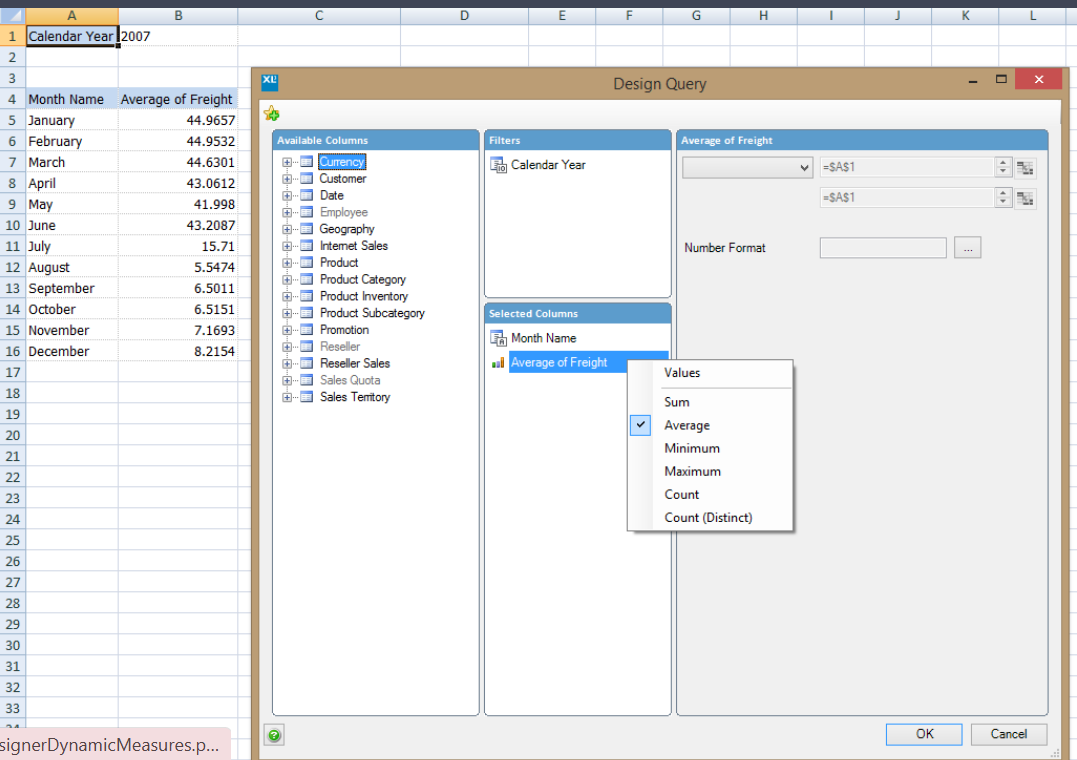
Dynamic Measures
You can create a measure from any column in the database.
To do this, right-click on the column and select how to aggregate the values.
For numeric columns you can choose from Sum, Average, Min, or Max, for other types you can do a Count of the values.
Tabular options
Tables based on DAX queries have additional options to enable controlling the query generation. These are found in the Table Properties screen on the DAX tab.
- Remove rows with blank measures: If measures are selected in the query, then one or more of them must be non-blank, otherwise the row is removed.
- Select Type: Affects how the columns are combined when querying the data.
- Crossjoin: All possible combinations are generated, for example, all Years and Countries are generated, even if there were no sales for a particular combination.
- Summarize: Only valid combinations are generated. This can improve performance in some cases, especially where many columns are retrieved.
- Transactional: Row-level data is retrieved and there's no aggregation. This can produce a very large number of rows if the set isn't correctly filtered.
- Compatibility: Allows the user to override how the DAX is written to produce a query that'll run for a particular version. It isn't recommended to change this.

