Use backtesting to estimate the performance of your forecast model.
Backtesting logic
When you create a forecast model, a backtest is automatically generated based on a subset of historical data (actuals). Note that:
- The data withheld is equal to the length of the forecast horizon.
- The trained forecast model automatically produces results for the period represented by the withheld data.
- Backtesting supports the comparison of forecast against actuals. The accuracy metrics shown on the forecast model page derive from this comparison.
Backtest example
You have 24 months worth of historical data and a 3-month forecast horizon.
- The model training process uses the first 21 months of historical data and predicts the remaining 3 months (these 3 months are held back as a comparison sample).
- Forecaster compares the forecast for the last 3 months with the actuals. This comparison results in accuracy metrics that estimate the performance of the forecast model.
- The data withheld is equal to the length of the forecast horizon.
- The trained forecast model automatically produces results for the period represented by the withheld data.
- Backtesting supports the comparison of forecast against actuals. The accuracy metrics shown on the forecast model page derive from this comparison.
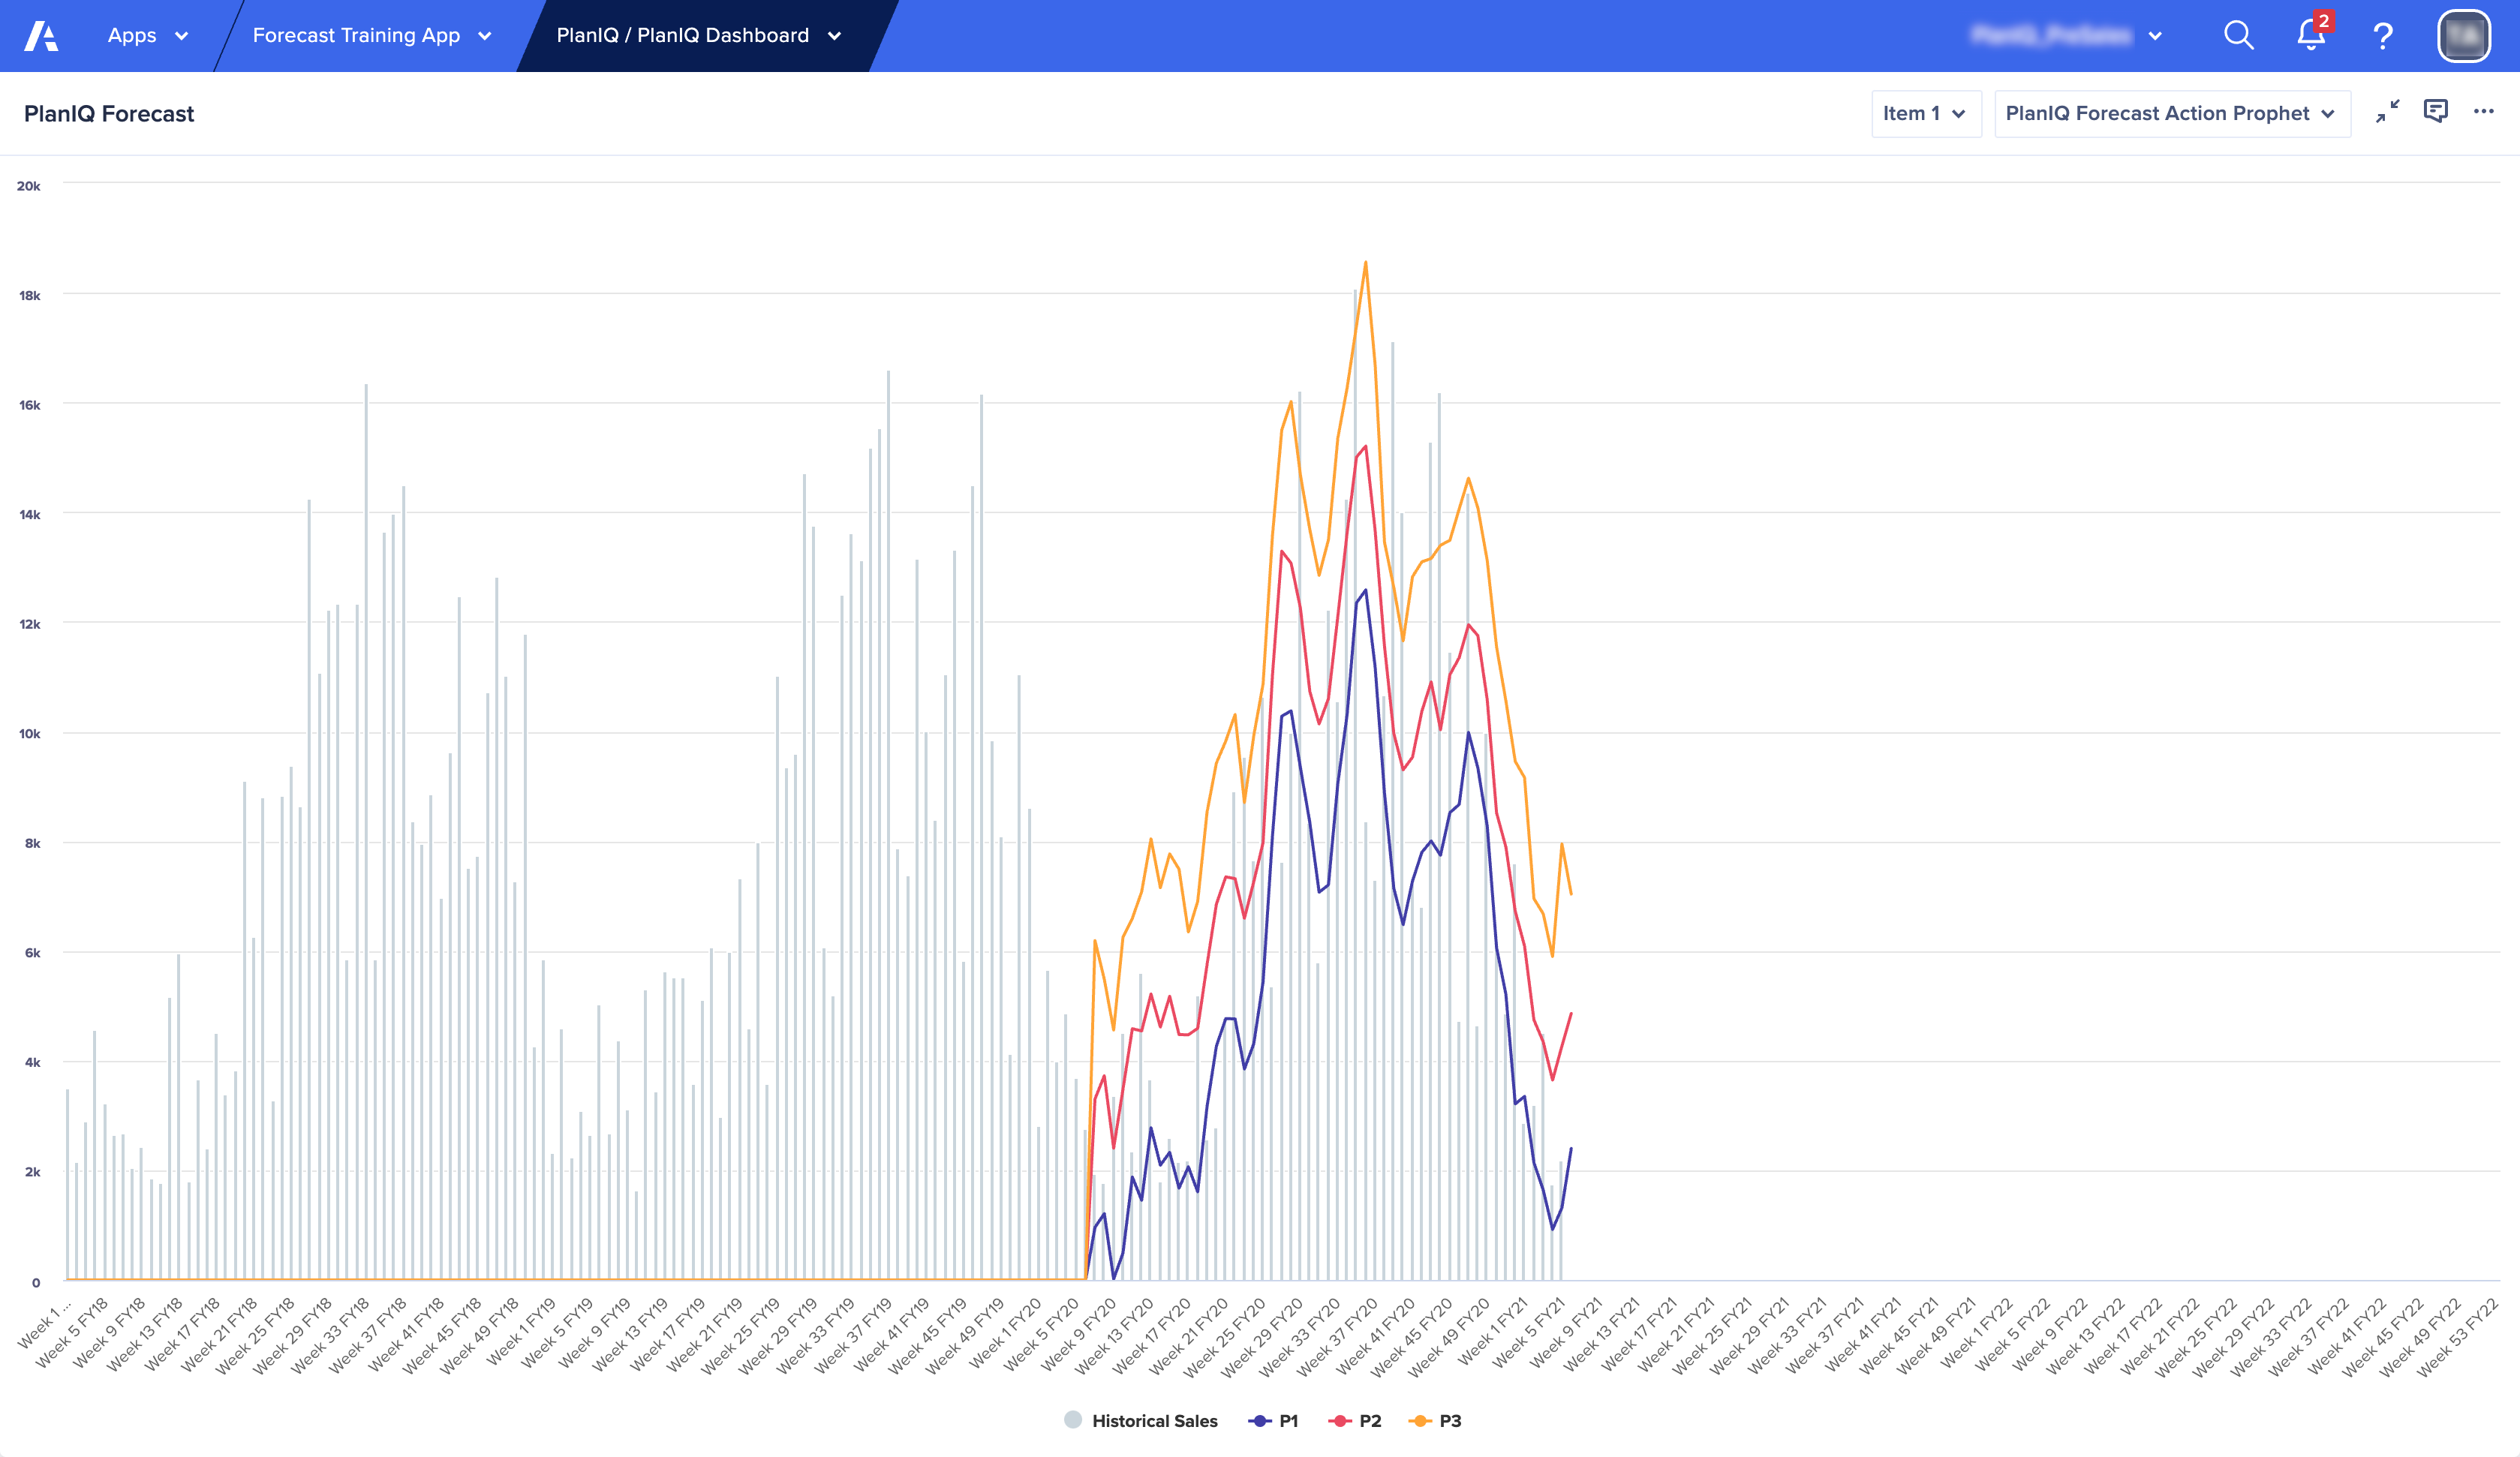
You can use backtest data and forecast model results to evaluate performance at the item level . The closer the forecasted values are to the actuals, the more accurate the model results are, and the better the estimated performance.
Example backtest results

The blue, red, and yellow lines are the forecast values. The gray lines are the actuals. The forecast values closely match the actual results for this time period.

