Conditional formatting enables you to change the visual style and color of cells. The formatting can be based on the values in the cells being formatted, or the values of a number-formatted line item.
Choose from three different formatting styles and a variety of colors.
The uses of conditional formatting include:
- highlighting data that is of particular interest;
- variance analysis;
- flagging values outside expected ranges; and
- identifying cells where action needs to be taken, or that users need to interact with.
You can use a color scale to apply color-grading to your cells. The colors are dependent upon a specified range of numerical values within the cells of a number-formatted line item.
The colors are shaded in a gradient between the minimum and maximum values you specify, with one or more optional middle values:
- Values less than, or equal to, the minimum value display in the color representing the minimum value.
- Values equal to, or greater than the maximum value display in the color representing the maximum value.
- If middle values are specified, the colors transition from minimum to maximum through the colors representing the intermediate values.
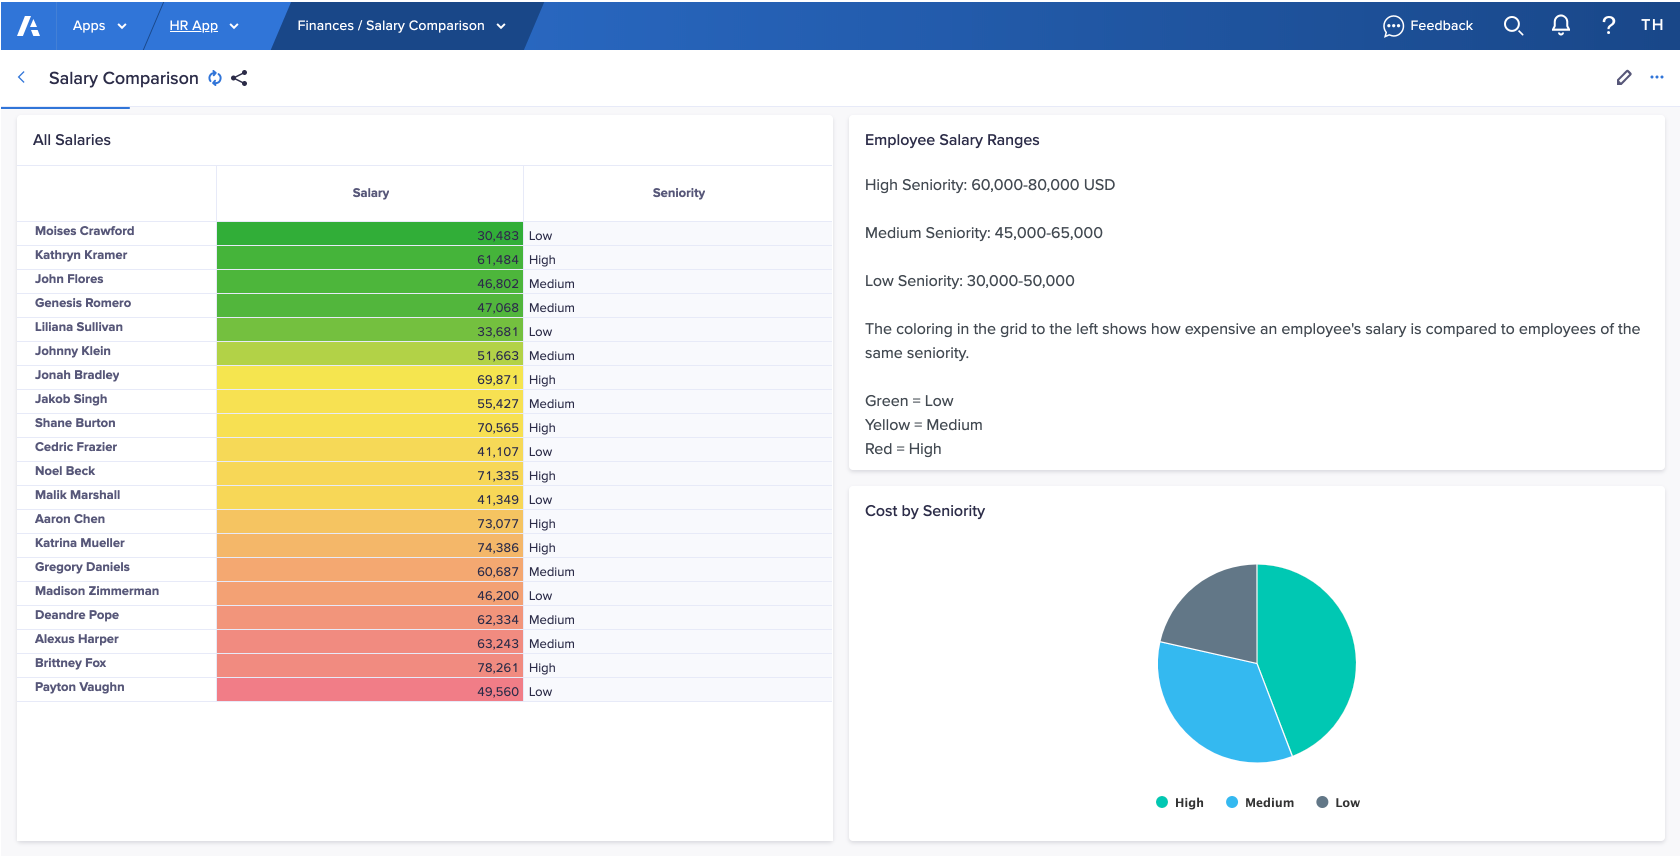
For example, a model builder can highlight whether an employee's salary is high or low for their seniority. To do this, they might apply formatting that is:
- green for salaries that are low,
- yellow for salaries in the middle range,
- red for salaries that are high.
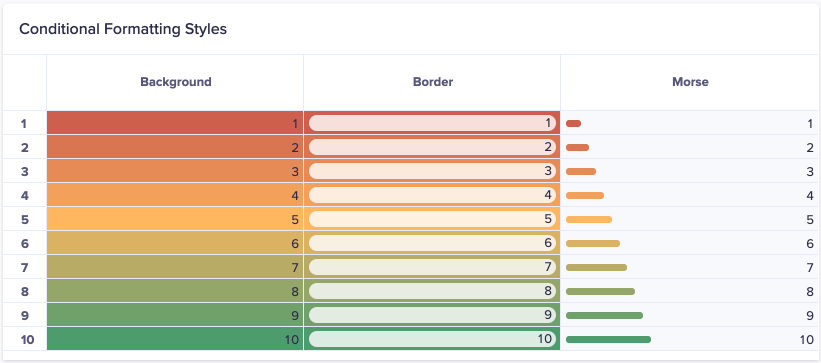
There are three different styles that you can use for conditional formatting:
- Background, which completely fills the background of each formatted cell with solid color.
- Border, which adds a colored border to each formatted cell and ensures that cell values remain easy to read.
- Morse, which adds a colored dot or dash to the left of the value of formatted cells. The size of the dot or dash depends upon the cell value. This style is useful for color-blind users.
Learn how to:

