Waterfall charts are part of Business Charts.
For a standard waterfall, set the desired hierarchy and members on categories. The chart will then display each value as a waterfall accumulating in a total column/bar.
Right-click options
Right-click on a waterfall column/bar to access options:
- Total: Set the category as a total, plotting from the category axis
- Subtotal: Plots from the last total
- Custom subtotal count: If the category is set as a subtotal, you can set a custom count for how many previous categories it's the total for. If this is unset, it subtotals from the previous total/subtotal (see example below)
- Negate: Plot the categories in the negative direction
- Auto total after: Add a total category after the selected one
- Auto total title: Change the category label of the auto title. The default is Total.
Members can be configured as totals/subtotals/expenses automatically using Business rules.
If you have member properties showing the point types, you can configure these in the Chart Properties screen.
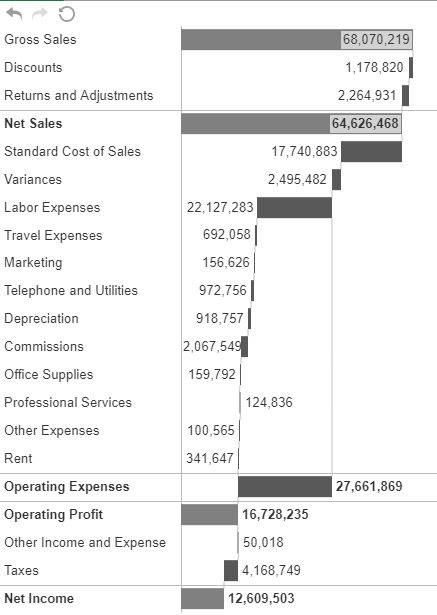
Custom subtotal count
The Operating Expenses member is set as a subtotal on the Business rules sheet. Because Standard Cost of Sales and Variances aren't child members of Operating Expenses, and the previous total/subtotal is for Net Sales, the subtotal lines don't line up correctly. You instead want the line to connect from the Labor Expenses category.
When you right-click set the custom subtotal count, in this case, set it to 10, then the subtotal is displayed correctly.
Format the Waterfall Chart
Formatting options are available in the formatting pane, including the option to add a delta arrow.

