This page helps you add or edit Lollipop in-cell charts in your report.
This dialog is used add or edit Lollipop in-cell charts in your report.
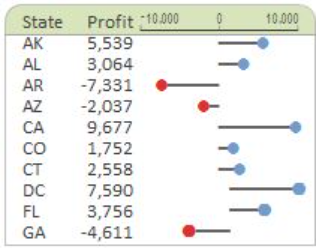
For details about how to invoke the dialog, review In-Cell Chart Designer.
Chart Options
Different chart options:
| Option | Description |
| Length | The horizontal scale factor to use when drawing the chart. |
| Bar Color | The color to draw the bar for positive values. |
| Pop Color | The color to draw the Pop of the Lollipop for positive values. |
| Negative Bar Color | The color to draw the bar for negative values. |
| Negative Pop Color | The color to draw the Pop of the Lollipop for negative values. |
| Reference Values | This gives you the option to define a reference value for the chart (displayed as a vertical bar) and select the color for the bar. |
Axis Options
The available Axis options:
| Option | Description |
| Customize axis | Allows you to select further options defining how the formula cell (for In-Cell Chart formulas), or the member name (when used in Grids) is rendered. |
| Use title only | Uses the given text as a caption. |
| Axis with tickmarks above | Draws a horizontal axis, with tickmarks and optional labels above the axis. |
| Axis with tickmarks below | Draws a horizontal axis, with tickmarks and optional labels below the axis. |
| Custom tickmark frequency | Overrides the automatic calculation of major tickmarks. |
| Minor ticks per major tick | Adds the given number of minor (labelless) tickmarks between each major tickmark. |
| Show labels on major ticks | Specifies whether numeric labels should be rendered for the axis. |
| Number format | The format string to be used for the axis labels. |
| Custom axis minimum | Overrides the automatic minimum for the axis. |
| Custom axis maximum | Overrides the automatic maximum for the axis. |

