

Advanced explainability uses linear attribution, SHapley Additive exPlanations (SHAP) for the Multivariate linear regression (MVLR) algorithm. The average forecast is the baseline.
Each prediction is broken down into the baseline plus one signed contribution per driver. The baseline and contributions add up to the prediction.
The Algorithm, Method, and Baseline display at the top of your view.
To learn more about how advanced explainabilty is calculated, see the Algorithms page.
Note: You may see a driver named Anaplan Postprocessing in the breakdown. It accounts for cases where Forecaster adjusts the raw model output. For example, converting negative predicted values to zero when the historical time series contains no negative values. Its contribution captures the effect of the adjustment, so the breakdown still adds up to the final prediction.
Explore advanced explainability
To break down predictions into the drivers that shaped it:
- After a forecast run, open the Advanced Explainability panel.
- Use the Choose an Item dropdown to select the item you'd like to explore.
- Use the tabs to switch between views and explore driver impact.
Note: The item you select applies to all four views. Each view shows the full set of drivers for that item.
Impact analysis
Impact analysis ranks the drivers that most influence the prediction for your selected item, summarized across all time periods combined rather than a single point in time. For each driver:
- Its effect is measured at each period.
- The direction (up or down) is set aside.
- The sizes are averaged into one number.
Each bar shows how big that driver's typical push is. A longer bar means it moves the prediction more.
Note: The values are for comparison only, and don't add up to the prediction. Because direction is set aside, a top-ranked driver may have little net effect if it pushes up approximately as often as it pushes down. Use Impact Distribution to see which direction and how consistently a driver pushes. Use Single Prediction Impact to see one specific period.
Impact Distribution
Impact Distribution shows how consistently a driver influences a prediction over time by plotting individual period contributions along a direction scale. Dots to the right push the prediction up, and dots to the left pull it down.
Look for a clean color split from left to right. This means the driver has a consistent, dependable relationship with the prediction.
Impact Dynamics
Impact Dynamics plots the prediction for your chosen item over time. The prediction, displayed as a solid line, is overlaid with its strongest drivers, displayed as a dashed line.
A reliable forecast has drivers that move with the prediction. Drivers that lead the prediction can act as an early warning, while drivers that lag behind the prediction tend to confirm a trend after the fact. When a driver and prediction suddenly diverge, this may be an anomaly or a structural change in the data that's worth investigating.
Single Prediction Impact
Single Prediction Impact breaks down how a single prediction was built for your chosen item. It starts at the baseline, then each driver pushes the running total up or down to reach that period's prediction.
The drivers account for the baseline and each contribution, and match the prediction for the selected period. Move the time slider to change the breakdown from one period to the next.
Example
The examples show how each view works in practice in macro rankings, direction consistency, and time periods.
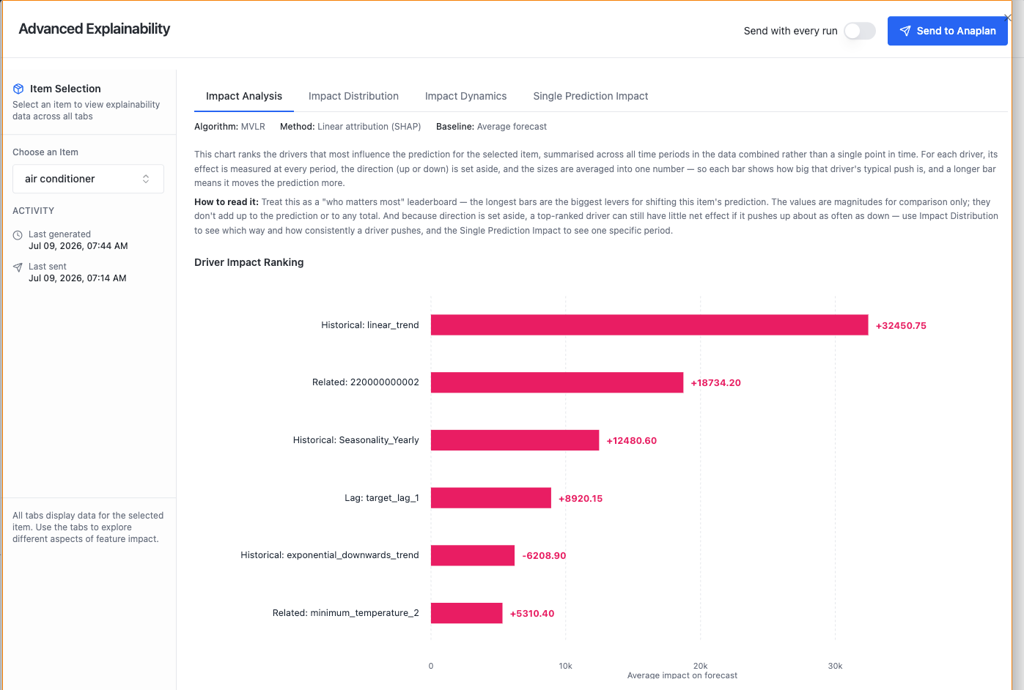
The Impact Analysis view displays the driver impact ranking for an air conditioner. Six drivers are ranked by their average impact across all time periods.
The linear trend is the biggest lever for this item. Its typical push is almost twice that of the next driver. The bottom two drivers still matter, but shifting them changes the prediction far less. To see which way and how consistently each of these drivers pushes, open Impact Distribution.
| Driver | Average impact | Interpretation |
Historical: linear_trend | +32,450.75 | Primary macro driver over time |
Related: 220000000002 | +18,734.20 | Strong secondary external driver |
Historical: Seasonality_Yearly | +12,480.60 | Significant recurring seasonal driver |
Lag: target_lag_1 | +8,920.15 | Short-term momentum driver |
Historical: exponential_downwards_trend | -6,208.90 | Moderate dampening effect |
Related: minimum_temperature_2 | +5,310.40 | Minor environmental driver |
While Impact Analysis reveals scale, Impact Distribution reveals behavior. By plotting each time period as an individual point along a directional axis and coloring points by feature value, you can verify whether a driver's behavior matches physical domain logic.
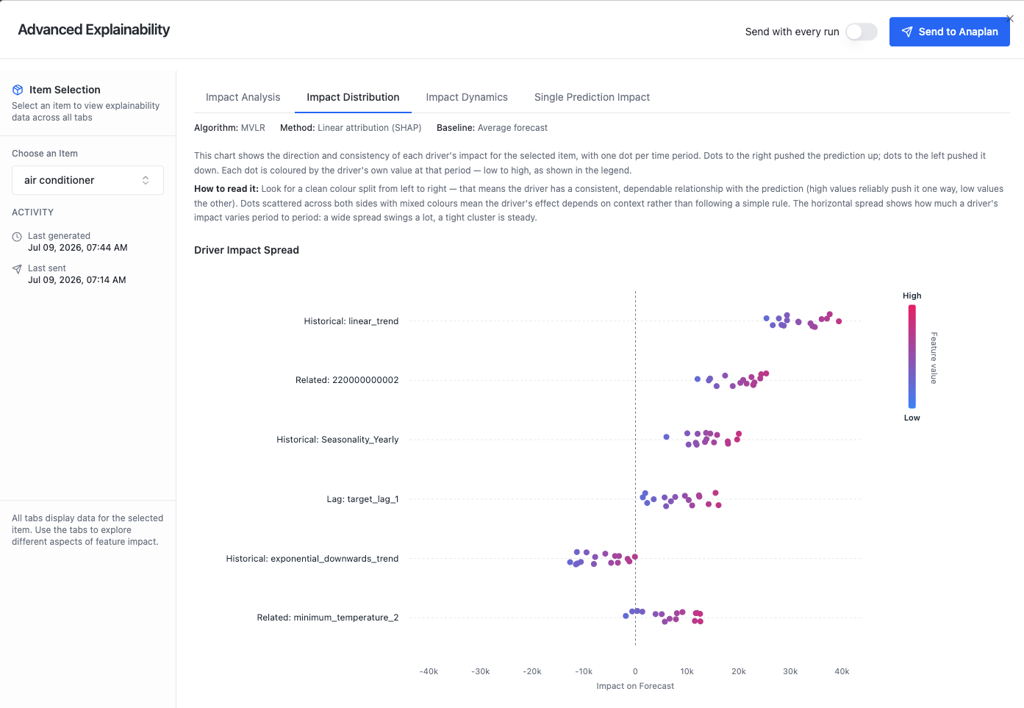
Forecaster has found three distinct driver behavior patterns for the air conditioner item.
| Driver | Distribution pattern | Behavior |
Historical: linear_trend | All data points cluster strictly to the right of 0 with a clear color gradient from low to high feature values. | Higher trend values consistently push the forecast upward in a predictable relationship. |
Related: minimum_temperature_2 | Low values gather near 0, while high values spread significantly to the right. | Cooler temperatures have a neutral impact, while warmer temperatures reliably drive demand spikes. |
Historical: exponential_downwards_trend | Data points sit entirely to the left of 0 with a tight horizontal spread. | A steady, low-volatility dampening effect across all time periods. |
The Impact Dynamics view plots the final forecast line alongside key driver series over time. You can observe push-and-pull behaviors and flag anomalies where the forecast trajectory diverges from its underlying drivers.
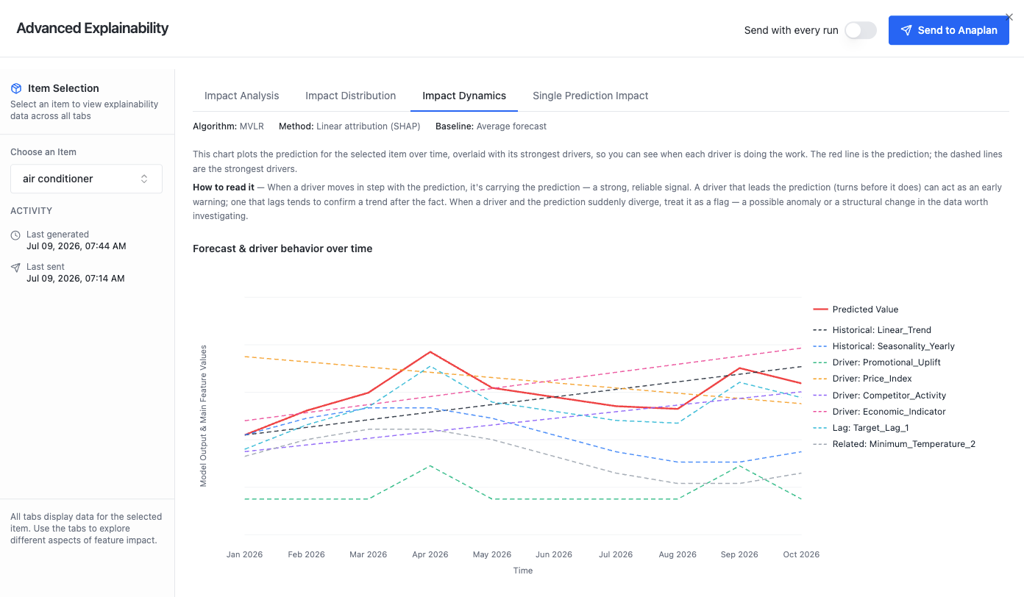
The air conditioner prediction curve climbs to a peak in April 2026, moderates through the summer months, and picks up again toward September.
| Driver | Evaluation step | Analysis and dynamics | Outcome |
Historical: Seasonality_Yearly | Primary signal | Rises and falls in synchronization with the prediction line. | Confirms seasonal demand accounts for the April peak. |
Historical: linear_trend | Baseline direction | Maintains a steady upward slope across all evaluated months. | Sets the baseline trajectory around which seasonal fluctuations occur. |
| N/A | Anomaly check | Both key drivers track expected behavior without diverging from the prediction line. | No periods require anomaly investigation. |
The Single Prediction Impact view breaks down a single point in time down to its mathematical components in January 2026.
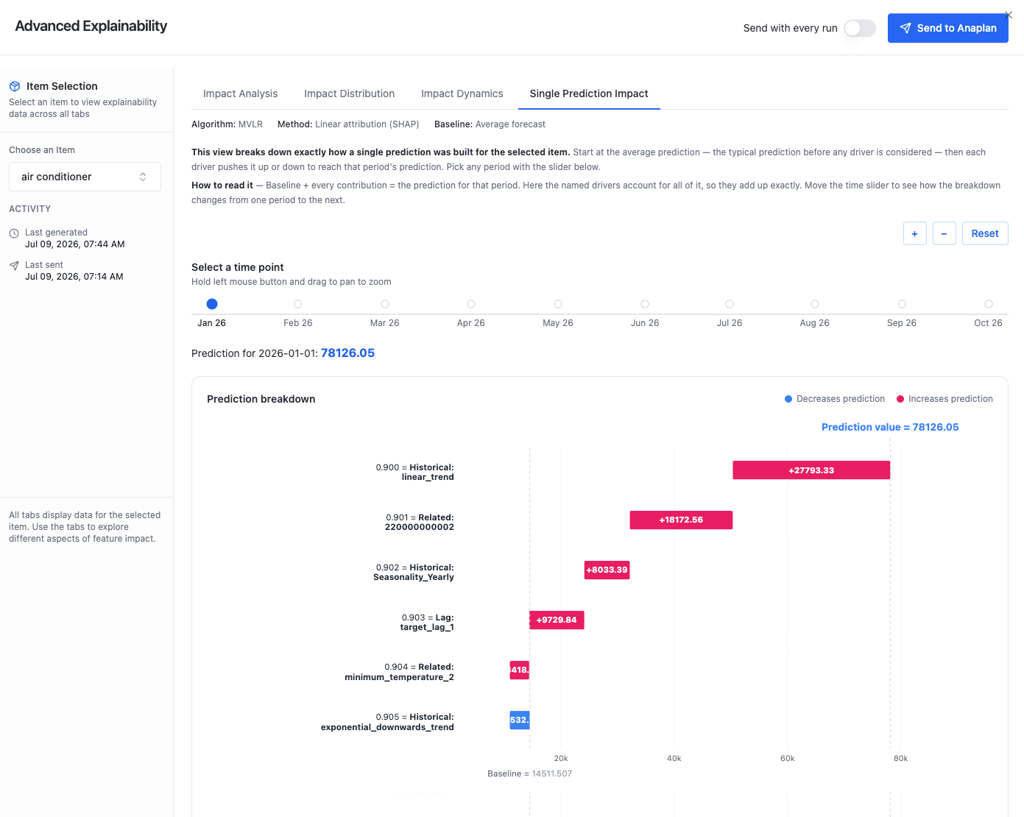
Five drivers push the prediction above the baseline, led by the linear trend and a related data driver, while one drive
| Component | Contribution type | Value |
Baseline (average forecast) | Starting point | 14,511.51 |
Historical: linear_trend | Positive push | +27,793.33 |
Related: 220000000002 | Positive push | +18,172.56 |
Lag: target_lag_1 | Positive push | +9,729.84 |
Historical: Seasonality_Yearly | Positive push | +8,033.39 |
Related: minimum_temperature_2 | Positive push | +418.32 |
Historical: exponential_downwards_trend | Negative drag | -532.90 |
Final prediction | Sum total | 78,126.05 |

