You need an item-level explainability module and import action to use the MVLR algorithm.
To create the forecast explainability module, you need to have already created a Forecast Action list.
To create a forecast explainability module.
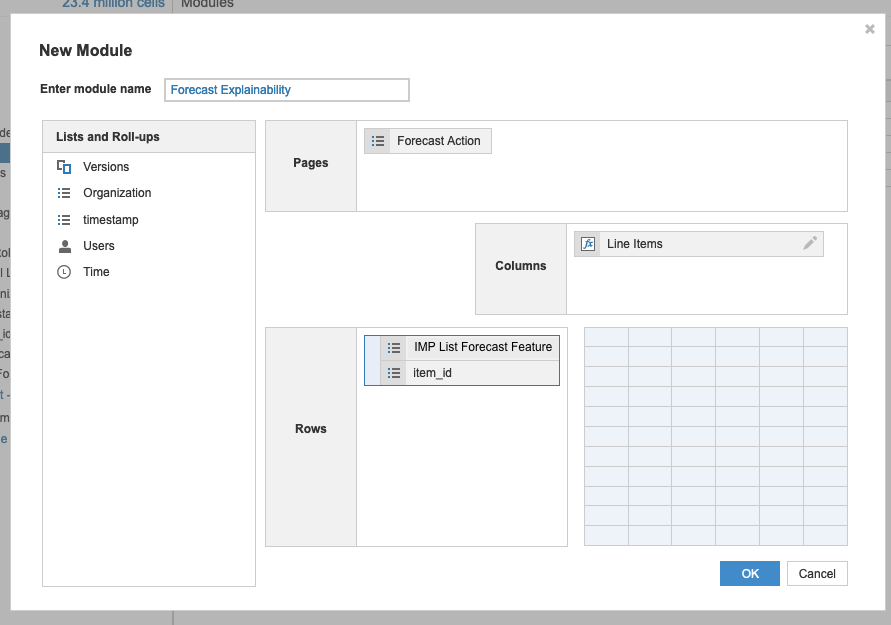
- Create a module called Module Forecast Explainability.
- From the New Module dialog:
- Use the Item ID list and Forecast Feature Names list as row dimensions.
- Use Line Items as a column dimension.
- Use the Forecast Action list as a page dimension (see screenshot 1 below).
The same list you create in Create a forecast results module. - Select OK.
- Add a line item called Feature Contribution. Format this line item as a number with percentage as the units.
- In Blueprint view, select None in the Summary column for the Feature Contribution line item.
- From the regular view:
- Select Import from the Data dropdown.
- From the Select Source dialog:
- Select import_action_setup_explainability.csv.
- Clickthe Select button.
- Select Admins Only from the Set as default file for dropdown.
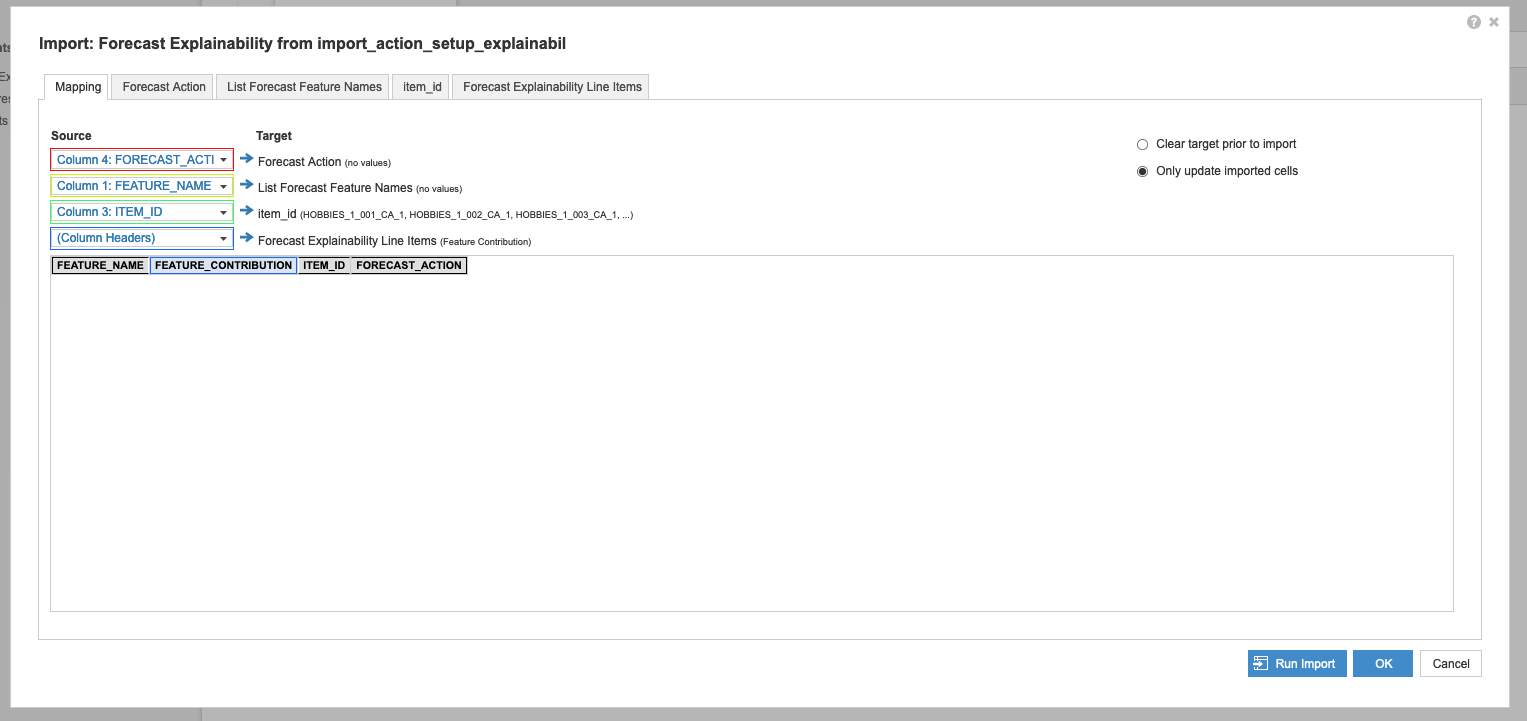
- From the Import dialog, Mapping tab:
- Map Source to Target. The table below provides an example. Your sources and targets will vary.
| Source | Target |
Column 4 FORECAST_ACTION | Forecast Action |
Column 1 FEATURE_NAME | List Forecast Feature Names |
Column 3 ITEM_ID | Item_id |
(Column Headers) | Forecast Explainability Line Items |
- Select Only update imported cells on the right (see screenshot 2 below).
- From the Forecast Explainability Line Items tab:
| Source items | Mapped To |
FEATURE_CONTRIBUTION | Feature Contribution |
- Note: Don't map the Item ID, Forecast Feature Names, or Forecast Action tabs. The Forecast Feature Names tab has no Target items until you run a Forecast action.
- Select Run Import.
Screenshot 1: Create a new module and set dimensions.
Screenshot 2: Example of Mapping for Forecast Explainability.