We launched several new features in October, including updates to User Experience and Cloudworks.
Released in October
User Experience
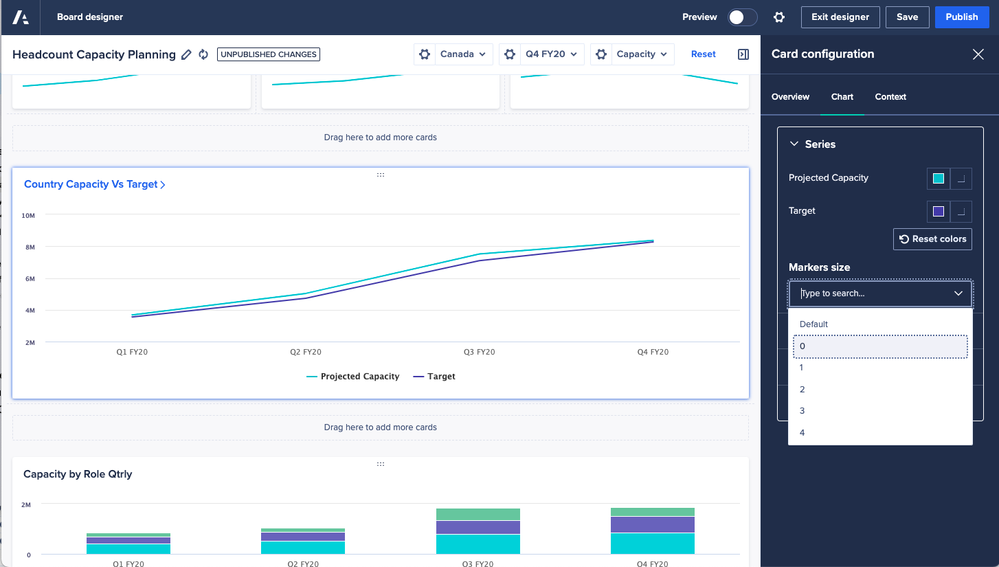
- Chart update - Marker size setting: We have added a new setting to allow page builders to set the marker size on charts. This includes the ability to set the size to 0, which will mean no marker is visible allowing a cleaner look and feel for line charts. This setting is available on the following charts:
- Line
- Area
- Dot
- Combination chart with any of the above
Management Reporting
- Presentation table font size - It is now possible for builders to update the font size on the presentation table in the report page. This enables report builders to fit more data on the report with a smaller font size or increase the font size to fill out the page or emphasise key summaries.
- Management Report PDF export improvements: We’ve made it easier to access multiple PDF exports of Management Reports. Now you can see and download up to 3 of your most recently exported reports within 24 hours of export, and you will be shown a more recent report if one is available when following an older export notification, so you’ll always know you’re downloading the report with the most up to date information.
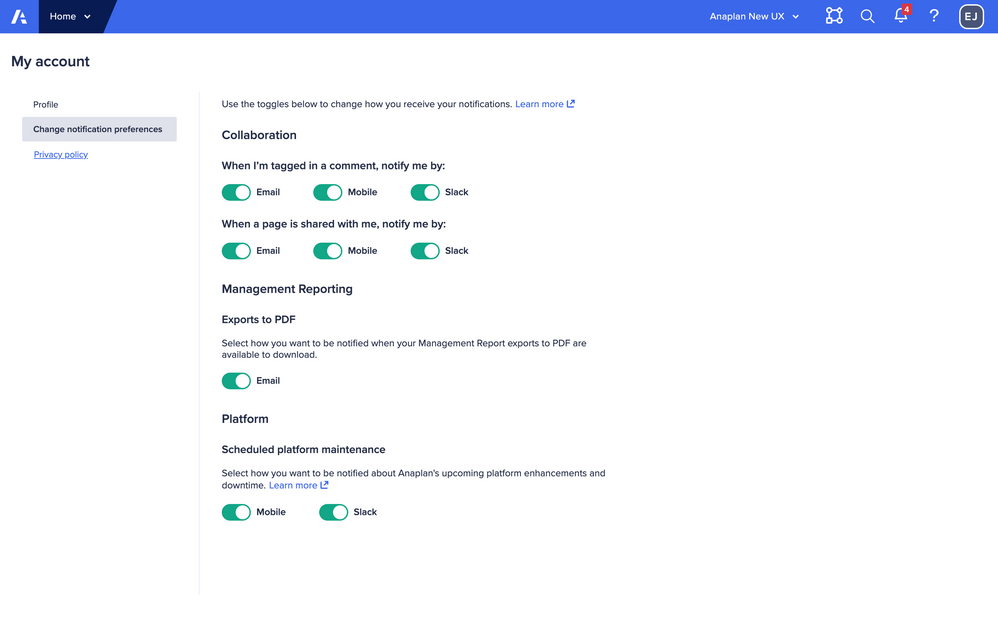
- We’ve also added the option to turn off email notifications for Report PDF exports, so you have greater control over how you’re kept up to date by Anaplan.
Cloudworks
- Export Filenames: Cloudworks will use the Export Action Name and the chosen Export format to generate the output file (e.g.: if your export action name is
Product Hierarchyand export format is ‘Comma separated values (.csv)’ then the output file would be saved asProduct Hierarchy.csv).
Note: If you name the export action with a format such asProduct Hierarchy.csv, the output file is namedProduct Hierarchy.csv.csv. To avoid the double file suffix, remove.csvfrom your original export action name
Targeted for November
Disclaimer: Please note: The information here is subject to change right up to release go-live time. This post is not a commitment to provide any features by a certain time frame and enhancements to the product may change before release. Subscribe here and check back frequently for the latest.
User Experience
- Drive the “clickability” of action buttons with Booleans: Builders will be able to define whether an end user action button can or cannot be clicked using a Boolean line item in their model. This offers maximum flexibility when modelling and can support use cases such as validating required data inputs before running an import, testing completeness of data before actioning a process, ensuring all inputs meet correct thresholds before allowing others to be alerted with a notification action.
- Assign action enhancements:
- Filter list items when using the Assign action: Further matching the functionality available in Classic dashboards, end users will be able to filter the view of available list items to assign using nominated list properties. This increases the speed at which items can be found and assigned, streamlining the experience for planners.
- Quickly assign list items by pasting their codes: If planners are tasked with assigning multiple items and have been supplied with a set of list item codes, they can quickly assign them in a single operation by pasting the codes directly into the Assign action interface.
- App management improvements: We are making changes to the interface for managing Apps to make it easier to see and manage archived Apps, and those associated with offline or archived Models.
- Pivot persistance in view designer: You can now pivot dimensions between rows and columns while keeping your applied customisations. This real-time pivoting removes the duplicated effort required to re-apply customisations each time, while providing the ability to amend your logic on-the-fly for a faster, more responsive build experience in the UX.
This advanced capability supports all features in the view designer when working with non-nested grids, not all customisations are supported in nested instances.
Anaplan for Microsoft 365
- Insert card details: Users will have the possibility to insert the details of the card before they insert it as data in Excel. This will provide more clarity and can be used in formula references. Users can choose which of the following details to include in their sheet: card name, model name, context selectors and time of the last refresh.
- Pivot grid cards after they have been inserted in Excel: Users can pivot the dimensions of a grid card after it has been inserted in an Excel workbook, by navigating through the Cards in Document menu
Modeling Experience
- Default Switchover: The New Modeling Experience will become the default experience in November 2022. It is replacing the Classic Modeling Interface but not eliminating Classic Dashboards or forcing you to use the UX Apps and Pages. See below resources for more information
- Community blog
- How to prepare for the change to the default Modeling Experience
- [Start Here] guide for Model Builders
- For end users, get to know the New Modelling Experience here
- Formula Auto Complete: Build formulas faster and more intuitively with automatic suggestions for functions and model objects while building.
Upcoming scheduled maintenance:
- November 12: Platform offline: Product Enhancements
- November 19: Platform offline: Infrastructure update
Have questions or looking for an update? Stay in touch:
- Stay up to date with upcoming downtime releases at status.anaplan.com
- Subscribe to the Platform Releases blog to learn more about product enhancements
- Review all of our scheduled platform maintenance windows in the Release Calendar

