Linear programming is a mathematical concept used to determine the solution to a linear problem. Typically, the goal of linear programming is to maximize or minimize specified objectives, such as profit or cost. This process is known as optimization. It relies upon three different concepts: variables, objectives, and constraints.
Variables are numerical or Boolean values, such as the quantity of product to be produced or whether a distribution center is open. Linear programming determines the optimal value for such variables. Objectives, such as maximum profit, are a linear function of an optimization’s variables. Constraints are also linear functions of an optimization’s variables, and are used to restrict the values an optimization can return for a variable. Constraints must be Boolean linear functions. Examples of constraints could be a specified ratio of budget allocation or the total number of items a factory can produce.
Thinking about linear programming in terms of a chart can help you visualize and understand it. Linear functions such as objectives and constraints are displayed as straight lines on a graph. Variables can be thought of as x and y, or values that we don't yet know. The chart below shows how it's possible to determine the feasible region for a linear program or optimization by plotting your objective and constraint linear functions.
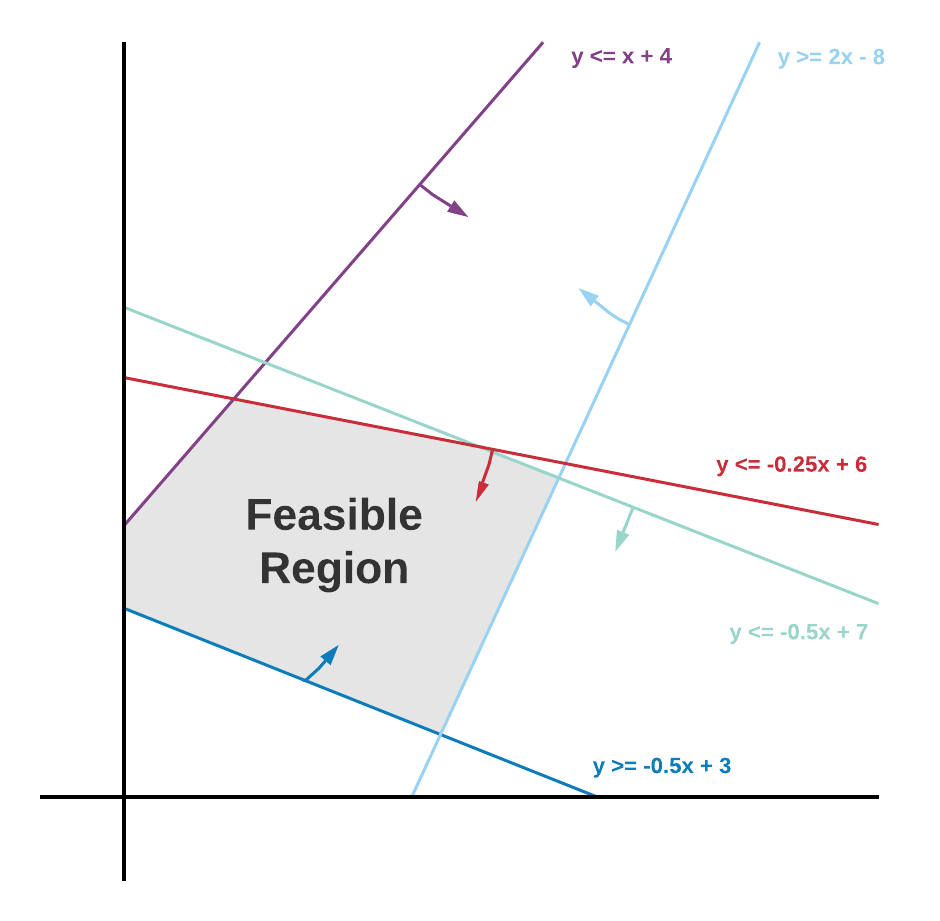
The optimal value for an objective is often in a corner of this feasible region, as this is the maximal or minimal feasible value for the objective.

