This is a sample dashboard based on Bicycle Sales data which is included with the product installation. It connects to a simple local cube file – BicycleSales.cub.
User selections
User selections are through two slicers, on Month and PoS. The grids in the workbook select the slicer directly, and the formulas are based on the cells in which the slicer updates.
The time slicer updates $D$2, and the PoS slicer updates $G$2.
Dashboard worksheet
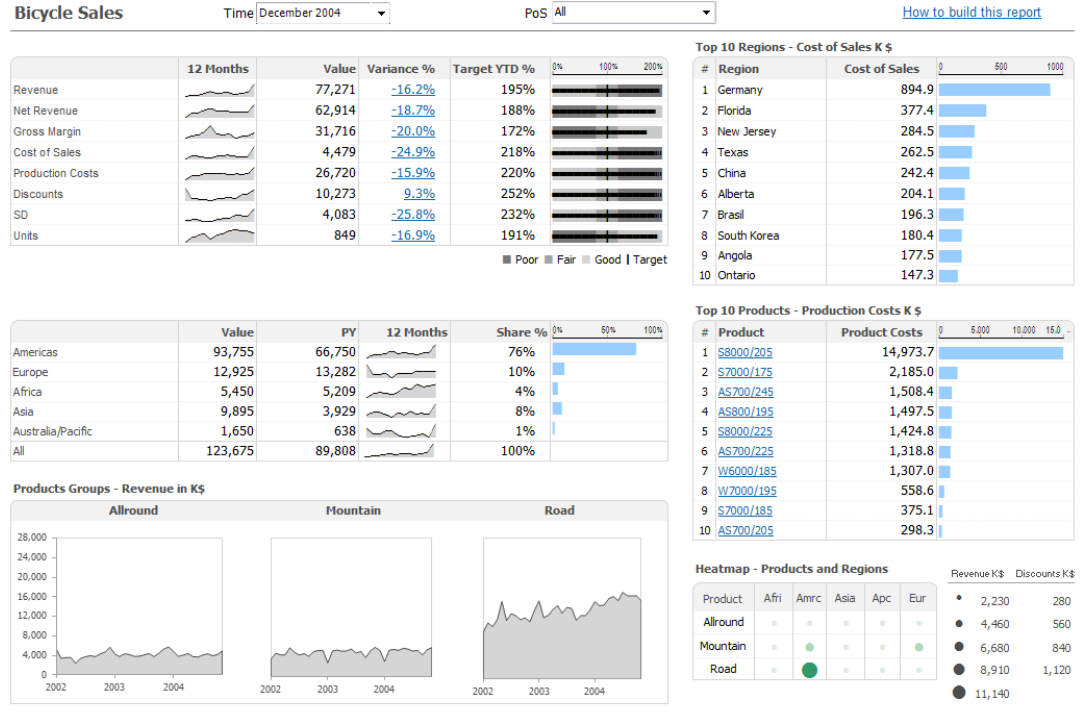
The KPI table is in cells (B5: G13) and consists of:
- An Anaplan XL Reporting Grid (B5: D13).
The grid header area is hidden in Grid Properties > Appearance. Time and PoS are in the header area, and select the respective slicers. The Sparkline is based on selected months plus the previous 11 members. - Anaplan XL cube and chart formulas (E5: G13).
The Variance % column uses an XL3Link () to enable the user to jump to detail on the selected KPI. The Bullet Graph in column G, built through an in-cell chart formula, is based on the Target YTD%.
The Region Table is in cells (B18: G24). It consists of an Anaplan XL grid (B18: F24), and an in-cell chart formula (G18). Time and PoS are in the header area, and select the respective slicers.
The Top 10 regions / products includes Xl3RankLookup and ValueRankLookup formulas. Product also uses XL3Link () to jump to detail.
Product Groups & HeatMap is built from Anaplan XL formula-based data on hidden sheets, and contains a Variance analysis sheet.
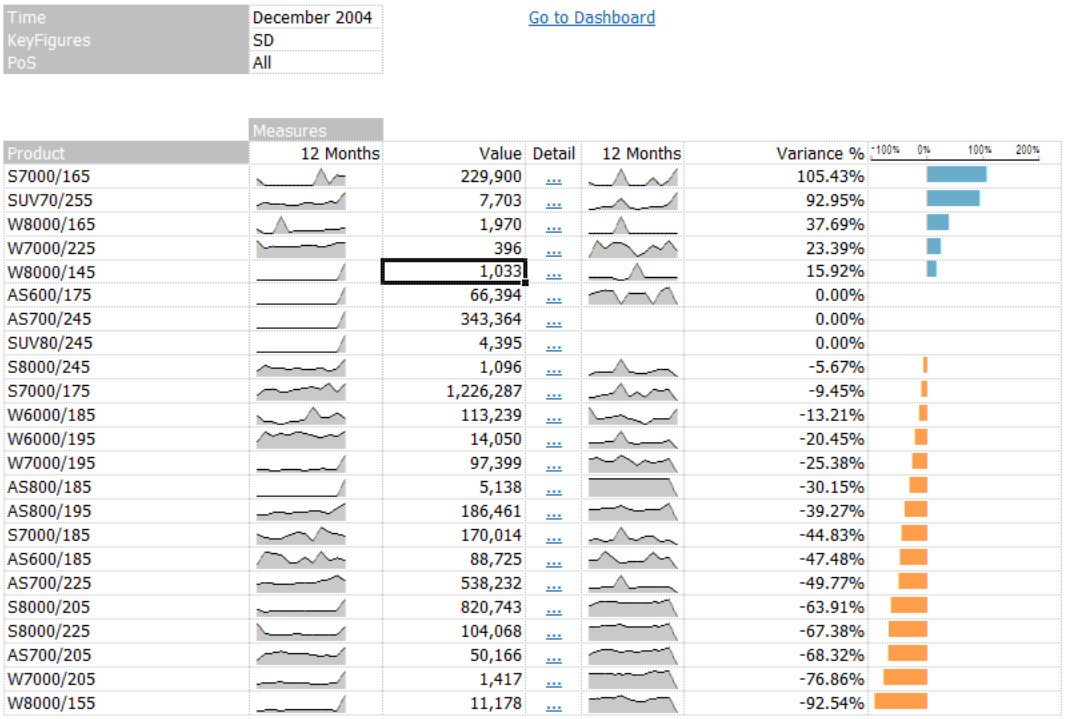
The Variance analysis sheet is built using one Anaplan XL grid, with embedded in-cell charting. It's restricted by PoS and Time slicers. For Key Figures, it uses VarianceAnalysis!D3 , which is populated by the XL3Link formulas on the KPI table within the Dashboard sheet. It ontains an additional XL3Link in column E, in a grid calculation, to enable you to jump to detail on the selected product.
Time Series chart sheet
The Time Series chart sheet contains a detailed table and chart of values and targets for the selected period, product, PoS, and the Key figure passed in by the xl3Linkformulae in Variance Analysis!$E$9: $E$29. Cell $O$8 is based on the selected month. C:N uses the XL3MemberNavigate () formula to choose the previous month, which means it'll show a rolling 12 months.
Note: It can also be achieved in a grid, by driving the date hierarchy from $C$5 and selecting the previous 11.

