We've introduced network charts to enable you to visualize your supply chain network.
You can use network charts to:
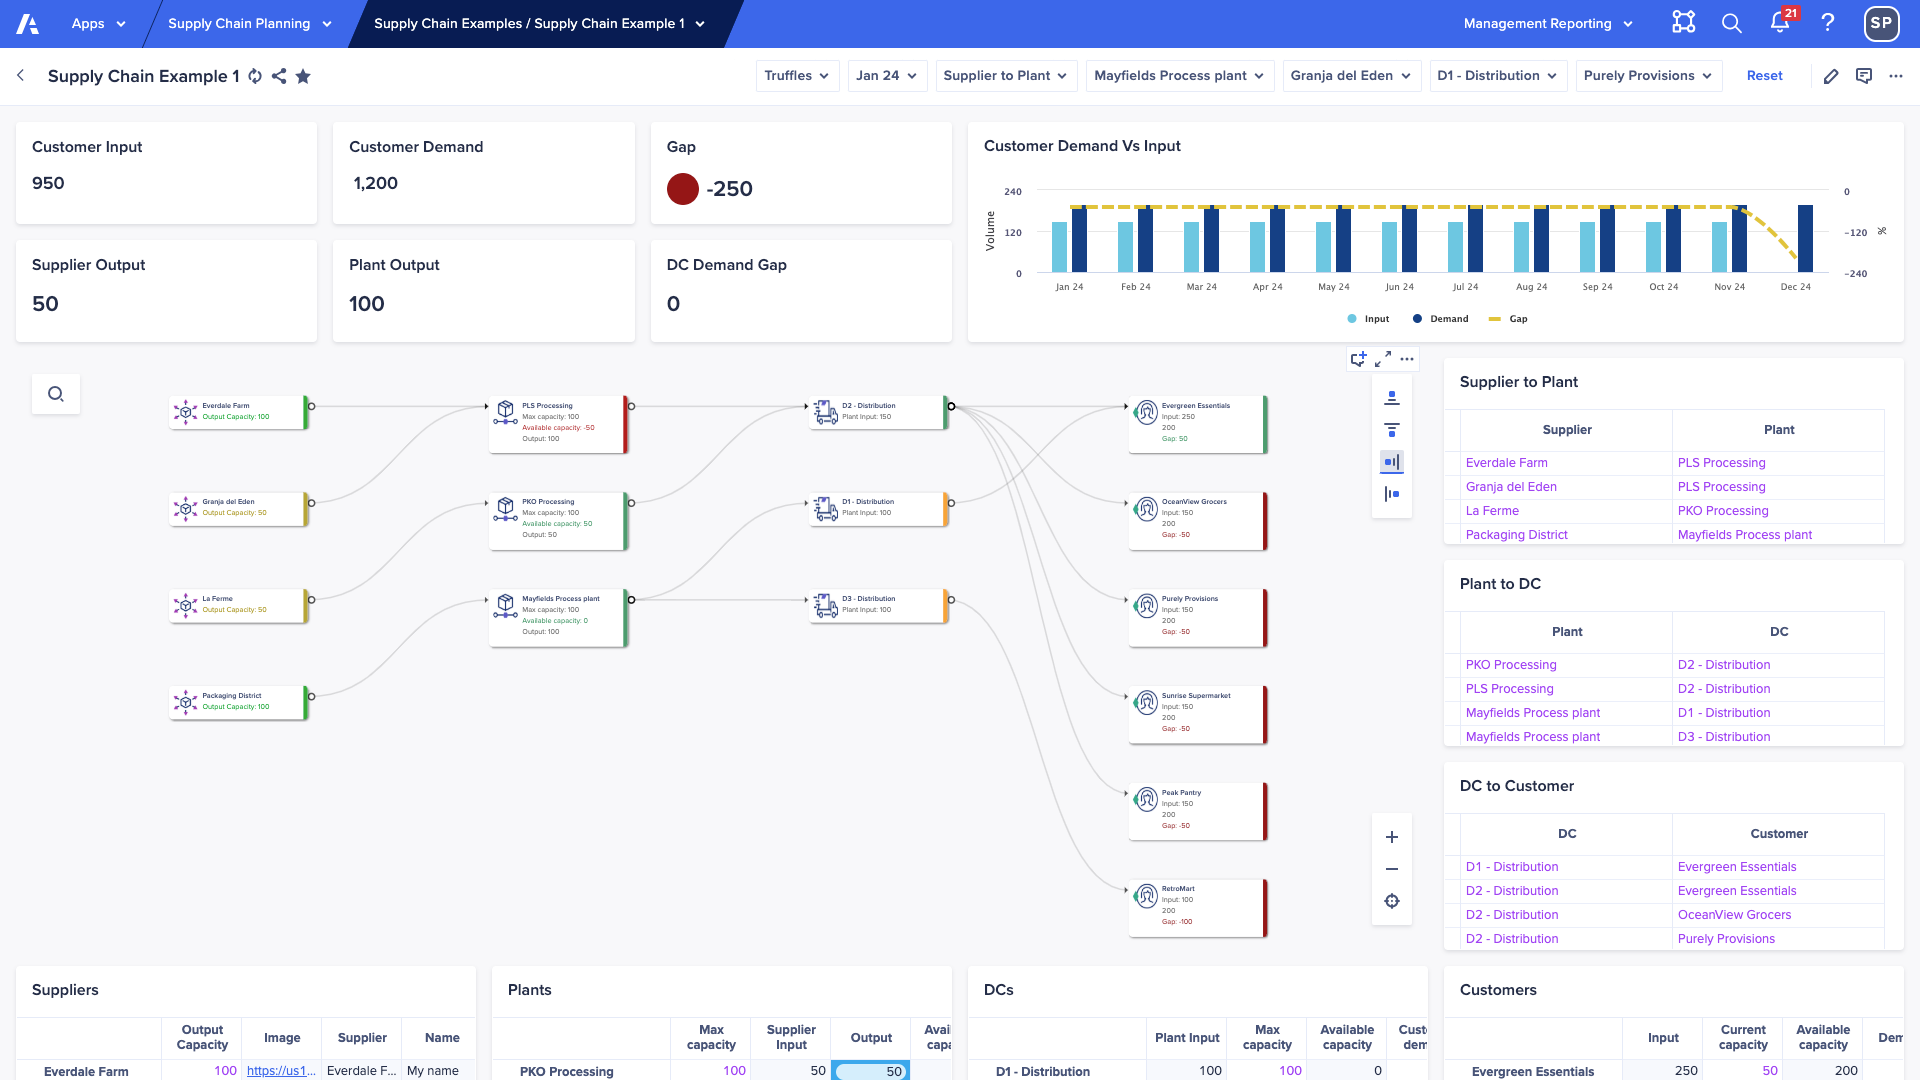
- Visualize the relationship from suppliers to plants to distribution centers to customers and identify bottlenecks.
- Use conditional formatting to highlight line items or production issues based on business logic.
- Update the model and see the impact in real time.
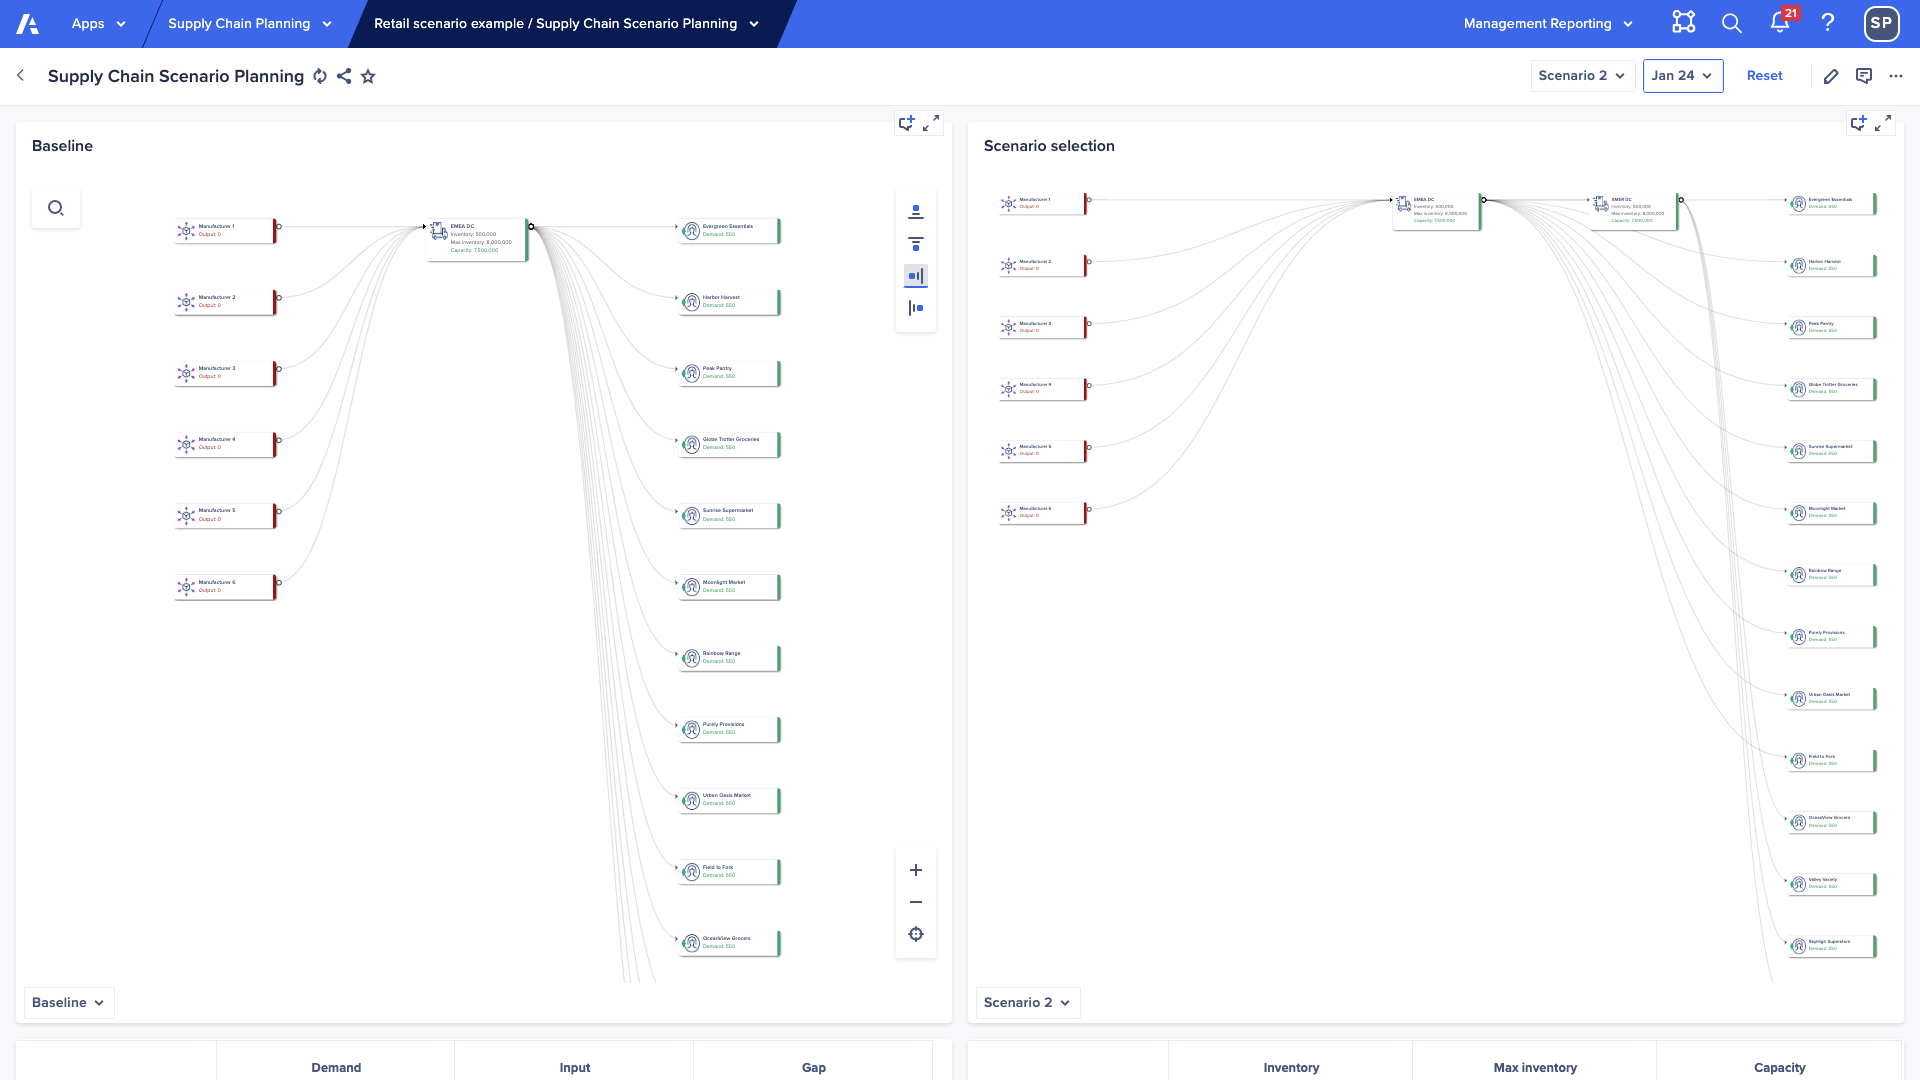
- Model multiple scenarios and see the impact over time.
- Check out the overview video here .
- Learn how to use and configure network charts here.
- Take the short training course here .

