You can easily create multi-level hierarchies in your pivot view.
Set Up
In this example, navigate to Anaplan XL menu, select Connections, and connect to a SQL Server database, such as AdventureWorksDW2014. Choose OK.
Creating a grid on this connection will prompt you to define the query. This'll then automatically create a pivot view. Alternatively, right-click on the connection in the connection screen and select Add Pivot View.
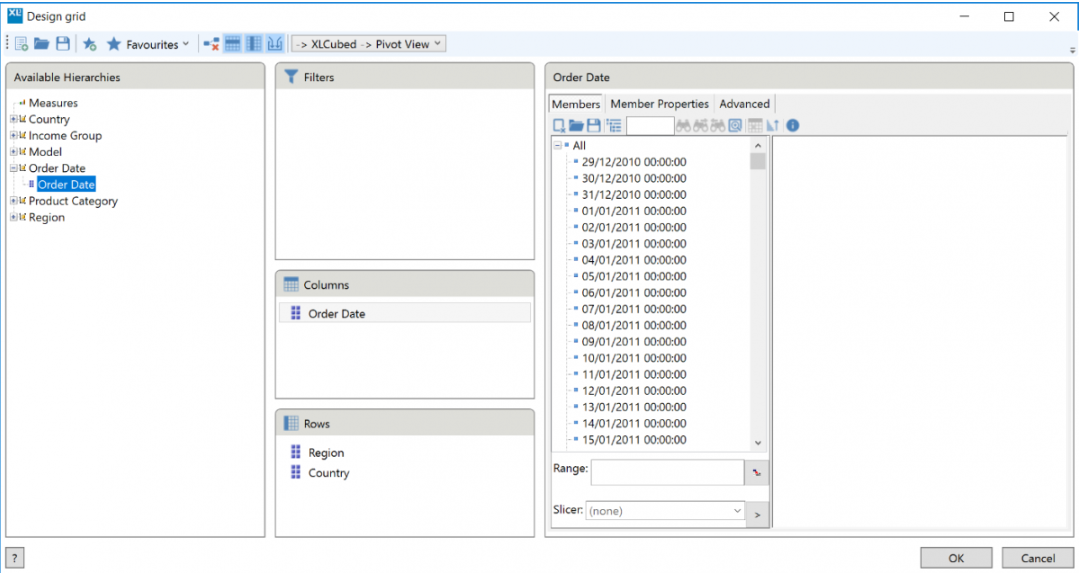
If you make a grid on this view, you will have the All member and then a list for each of the available levels. For example, when you expand Order Date, you'll see a list of all the members in that level. This would enable you to select days individually, but a hierarchy with year and month groupings would give a lot more flexibility.
Edit a pivot view
Go to Manage Connections and you'll see a Pivot View connection. This is the Anaplan XL view of the flat SQL-based data. Edit the Pivot View connection to define multi-level hierarchies.
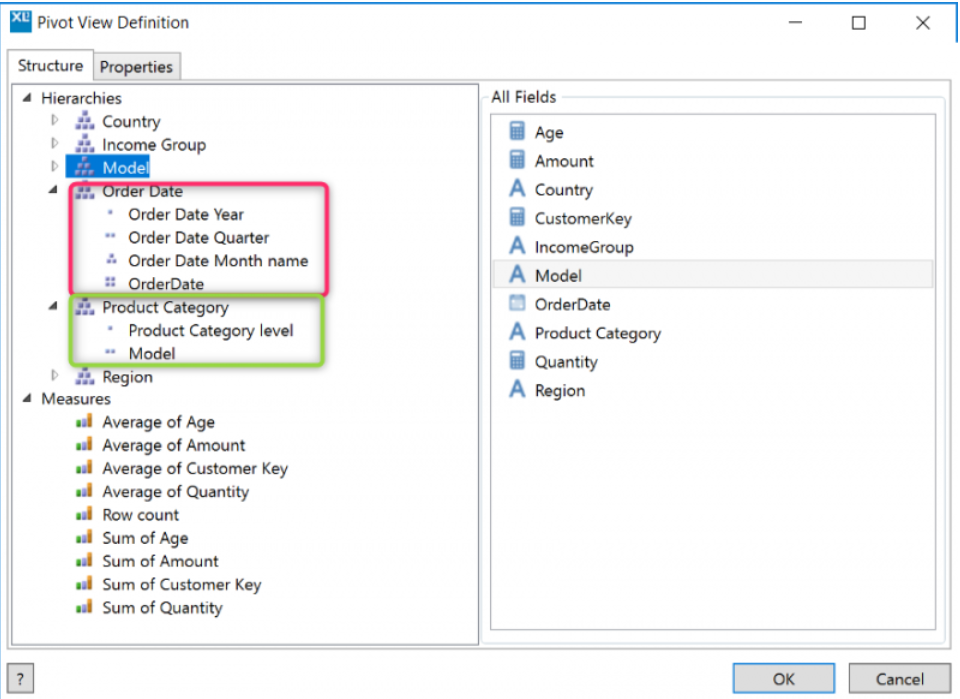
This'll open the Pivot View Definition Dialog.
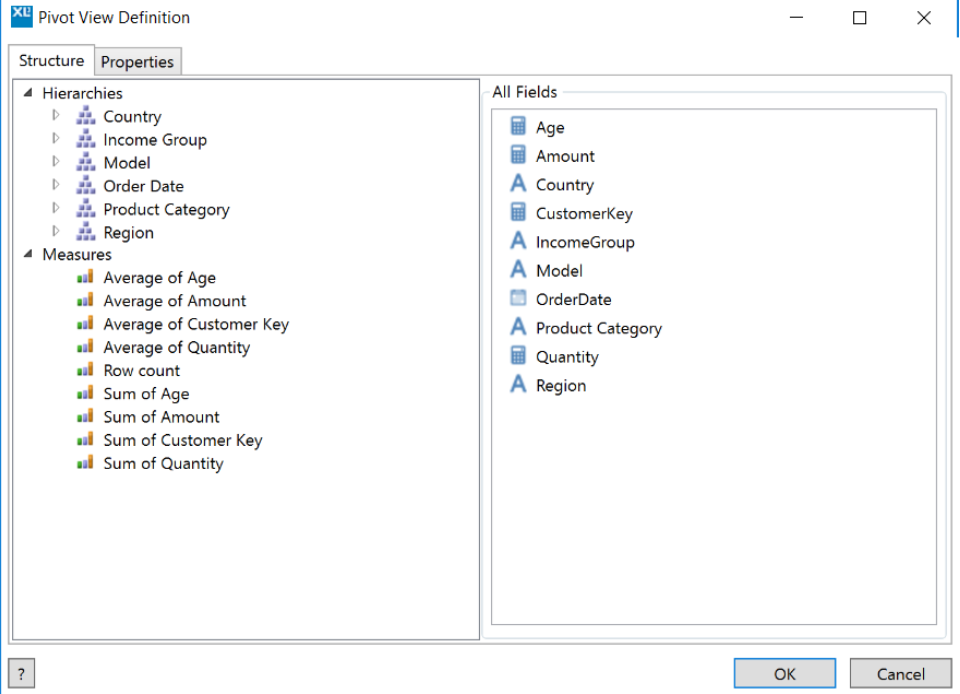
Multi-level hierarchies
To manage multi-level hierarchies:
- Drag and drop fields from the right side over to the desired hierarchy. For example, you can define the product hierarchy by dragging Model across onto the Product Category dimension.
- Levels can be re-positioned by dragging and dropping levels above/below each other.
- Right-click on a hierarchy or level to rename or delete it.
Calculations
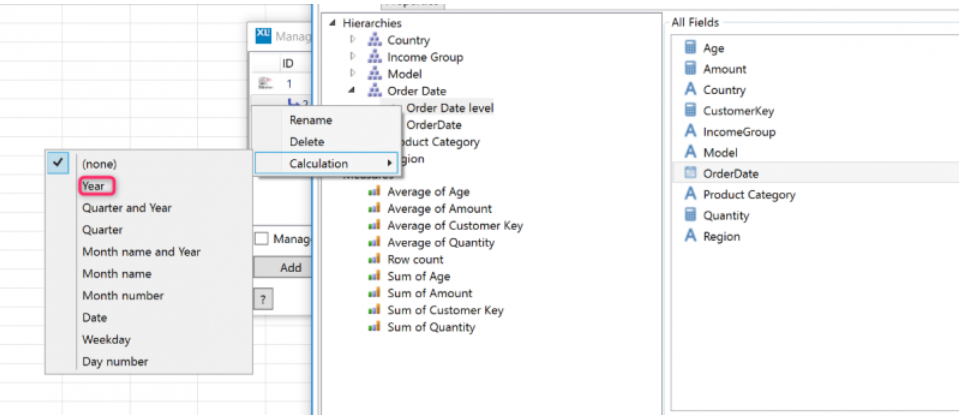
Set up a date hierarchy with Year, Quarter, and Month levels based on Order Date.
Drag OrderDate from the right-hand side of the window to the Order Date hierarchy. You can do this as many times as required – once for each level you wish to create.
Right-click to use the pre-defined calculations and then repeat the process for Quarter and Month name.
Add a grid
The newly created hierarchies are now available when you add a new grid or edit the originally added grid.
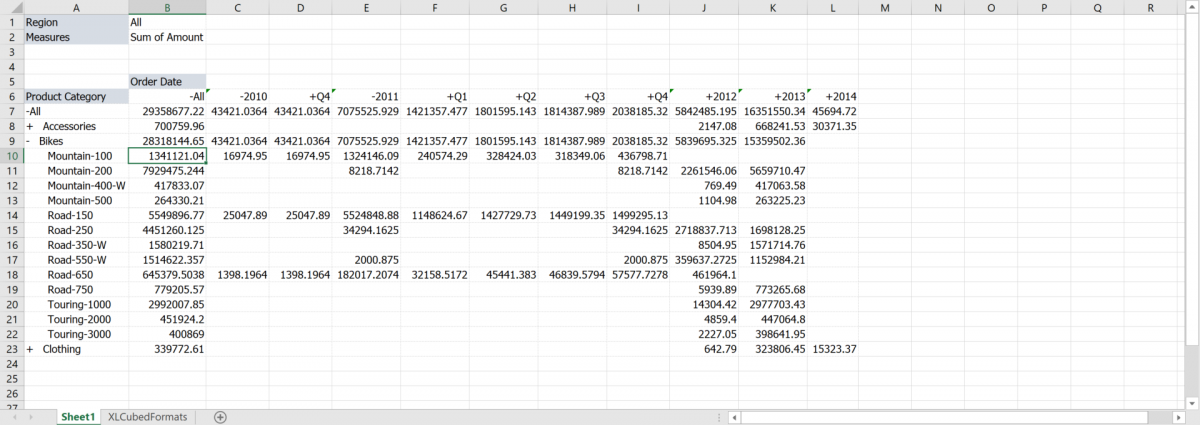
For example, design a new grid with Region and Measures as Filters, Order Date on columns, and Product Categories on rows.
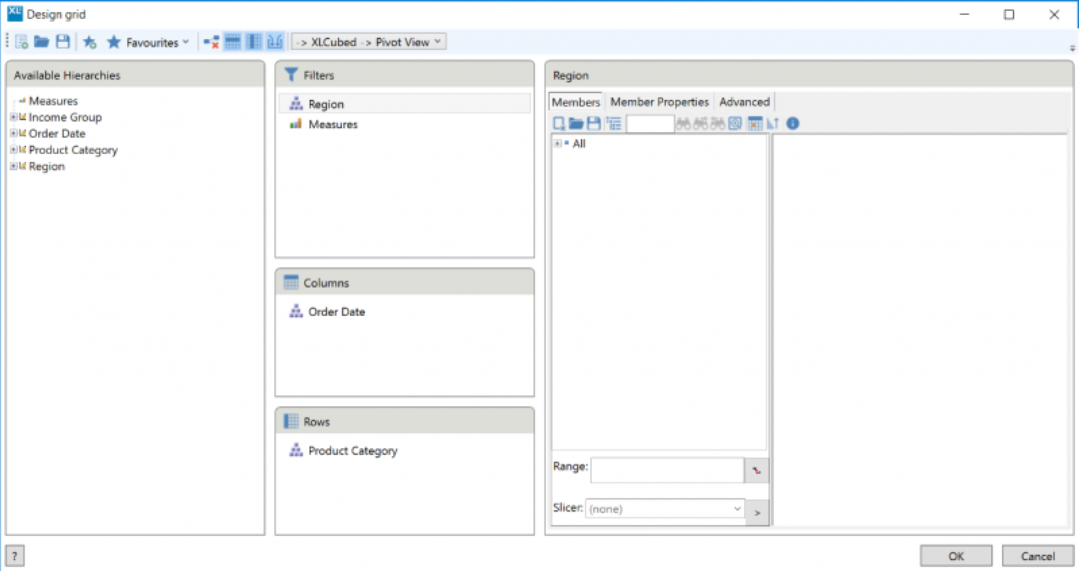
Drill down into the order date and you'll see the Years, Quarters, and Months as defined as well as Product Categories at a Model level.