
Use the LOOKUP function to look up values in a source module or list and display the values in a target module using mapping criteria. These examples demonstrate how you can use LOOKUP in different scenarios in your models.
LOOKUP items from a list
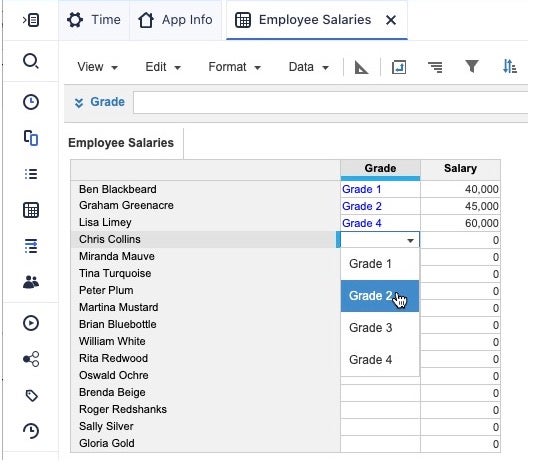
This example shows how to look up salaries from a list, Grades, and populate the Employee Salaries module with salaries.
Source list property
The Grades list has a property called Salary, which is formatted as Number. The Grades list looks like this in Grid View:
| Parent | Code | Salary | |
| Grade 1 | 40,000 | ||
| Grade 2 | 45,000 | ||
| Grade 3 | 50,000 | ||
| Grade 4 | 60,000 |
Results module
The Employee Salaries module has the Employees list on the rows and two line items on the columns called:
- Grade, a List data type on the Grades list.
- Salary, a Number data type, with this formula:
Grades.Salary[LOOKUP: Grade]
In the Employee Salary module, when you select the grade for an employee, the Salary field is populated with the corresponding value from the Grades list.
LOOKUP example using multiple mappings
Say you want to look up the salary for employees. You have a Pay table module based on grade and region and you want to display the salary in an Employee salaries results module.
The mapping between source and results modules is done on Region and Grade.
Region and Grade are dimensions in the source module, Pay table. These are also list data type line items in the results module, Employee salaries.
For the results module, LOOKUP uses the mappings for Grade and Region to return employee salaries from the source module Pay Table, and the line item Basic Pay.
The formula used to get the figures in the Salary column is:
Pay Table.Basic Pay[LOOKUP: Grade, LOOKUP: Region]
Source module
The source module, Pay Table, has a line item on pages, Basic Pay, which has a number data type. It has the Region list on columns, and the Grades list on rows.
This table shows the data for the Basic Pay line item:
| Region A | Region B | Region C | Region D | |
| Grade 1 | 20,000 | 21,000 | 25,000 | 33,000 |
| Grade 2 | 30,000 | 31,000 | 35,000 | 38,000 |
| Grade 3 | 40,000 | 41,000 | 45,000 | 49,000 |
Results module
The Employee salaries module has the Employees list on rows, and the following line items on the columns:
- Grade, a list data type on the Grades list.
- Region, a list data type on the Regions list.
- Salary, a number data type, with the formula:
Pay Table.Basic Pay[LOOKUP: Grade, LOOKUP: Region].
The table shows the Employee salaries module. When you select the Grade and Region for each employee, the Salary value is populated for the employee by the LOOKUP formula.
| Employees | Grade | Region | Salary |
| Employee x | Grade 2 | Region B | 31,000 |
| Employee y | Grade 3 | Region C | 45,000 |
| Employee z | Grade 3 | Region A | 40,000 |
LOOKUP example using time periods
This example shows you how you can use LOOKUP on a time period. You have a source module, Pay region, and a results module, Staff costs. You look up the staff costs in the Pay region module, and map the costs by Region and Period.
LOOKUP and time periods
You can use LOOKUP when the source line item is a finer timescale than the mapping line item data type. You can also use LOOKUP when the dimension of the target line item is a finer timescale than the dimension of the mapping line item.
However, if the time scale that you use in the results doesn't exist in the source, then LOOKUP returns 0. For example if you select Half-year totals in the results but it isn't selected in the source, LOOKUP returns 0.
Source module
The source model, Pay region, has a line item on pages, Pay, which is formatted as a number. It has the Regions list on columns, and the Time dimension on rows.
This table shows the data for the Pay line item:
| Jan | Feb | Mar | |
| Americas | 160,667 | 166,500 | 176,250 |
| Europe | 166,833 | 166,833 | 166,833 |
| Asia Pacific | 129,333 | 137,000 | 143,917 |
| All Regions | 456,833 | 470,333 | 487,000 |
Results module
The results module, Staff costs, has the following line items in columns:
- Regions, a list data type on the Regions list.
- Period, a Time Period data type with Month selected.
- Costs, a number data type with the formula:
Pay region.Pay[LOOKUP: Regions, LOOKUP: Period]
The Transactions list is in rows.
This table shows the Staff costs module.
| Regions | Period | Costs | |
| Transaction 01 | Europe | Jan | 166,833 |
| Transaction 02 | Americas | Jan | 160,667 |
| Transaction 03 | Asia Pacific | Jan | 129,333 |
You can see that the values in the Costs column come from the Pay region source table. For example, the Transaction 01 value of 166,833 comes from the cell at the intersection of Europe and Jan.

