The explainability results module gives insight into which underlying features have the greatest impact on forecast results.
To create the module:
- Create a list called Forecast Feature Names.
The list needs to be an empty one. Forecaster auto-populates it when you run the forecast action. - Create a module called Forecast Explainability Results.
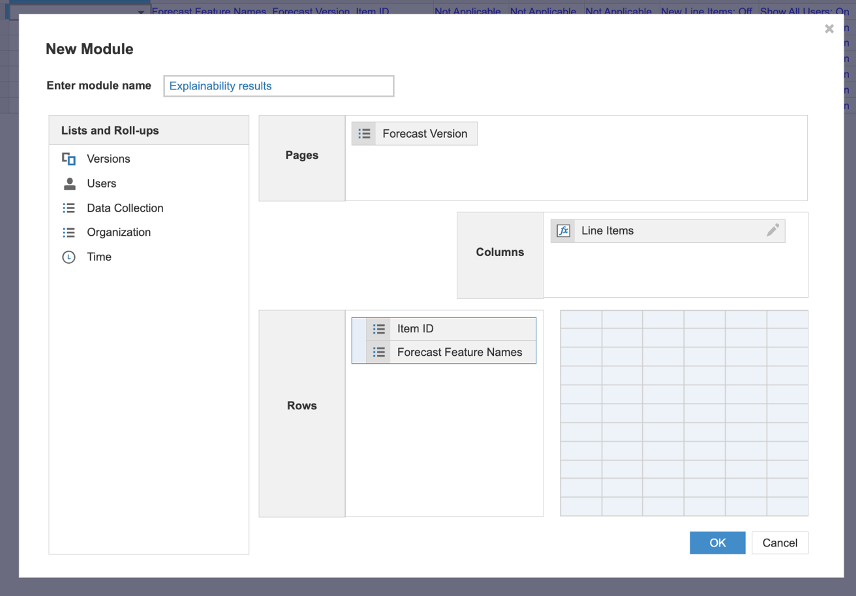
- From the New Module dialog:
- Use the Item ID list and Forecast Feature Names list as row dimensions.
- Use Line Items as a column dimension.
- Use the Forecast Version list as a page dimension (see screenshot two below). This is the same list you used in the forecast results module.
- Select OK.
- Add a line item called Feature Contribution. Format this line item as a number with percentage as the unit. You can't use line items that are configured as summary items.
- Add a line item called Applicable Forecast. Format this line item as a Boolean.
Example of an explainability results module: