The forecast results module contains both backtest and forecast results.
To create the forecast results module:
- Create a list called Forecast version.
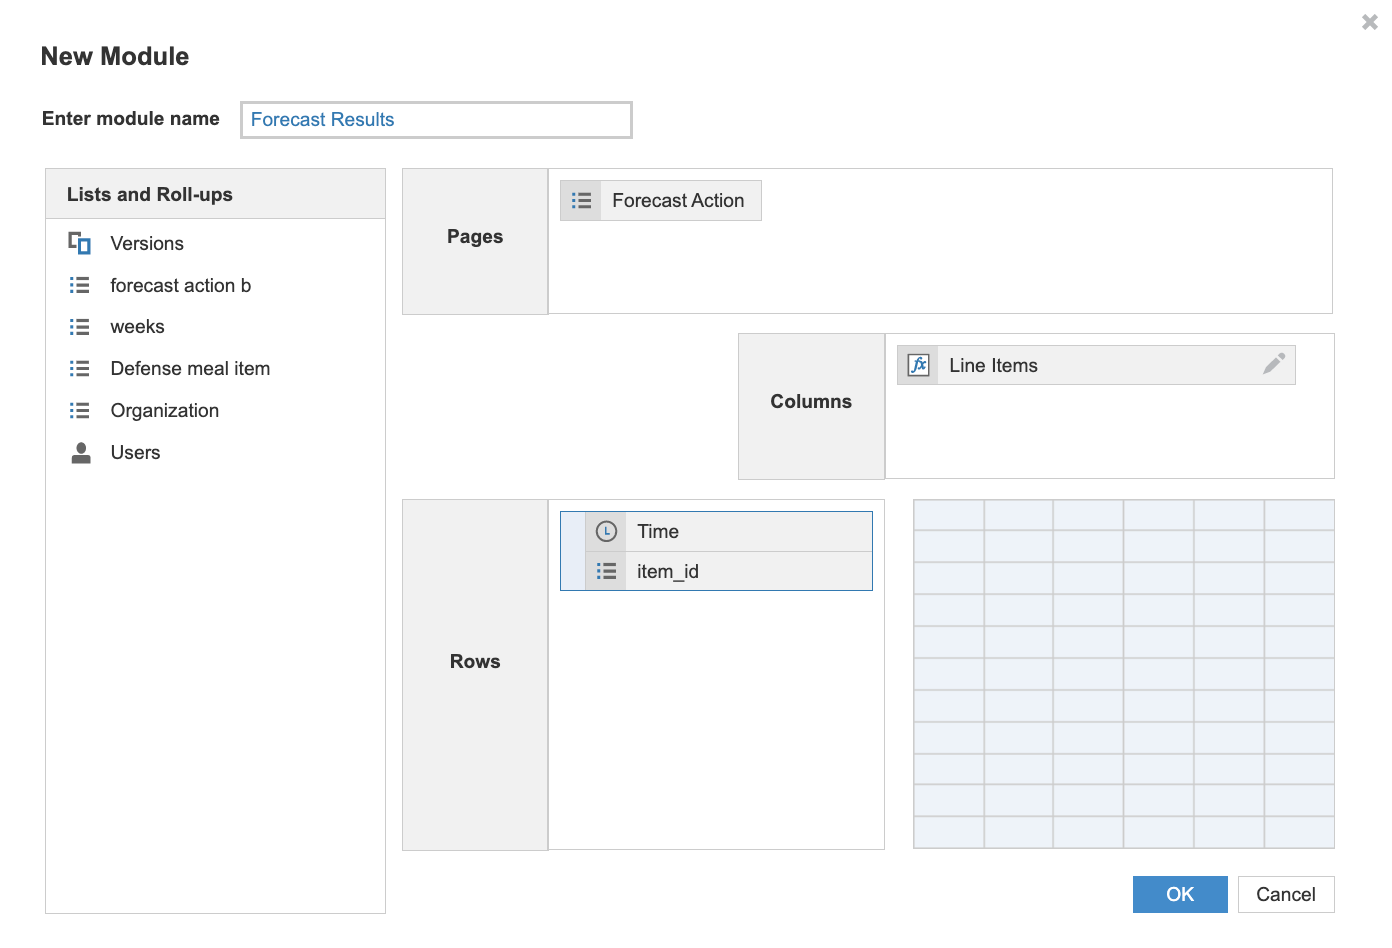
After you complete the setup, this list includes the names of the forecasts you create in Forecaster. - Create a module with four components, as shown below.
- (1) Forecast version as a page selector.
- (2) Time dimension as a row.
- The frequency of the data should correspond to that of the desired forecast frequency.
- (3) Item ID list as a row (the same list used in the historical data module).
- (4) New line items as columns. Create these line items:
P1,P2,P3
Only P2 is required (see note below). The P1, P2, and P3 line items contain the forecasts generated for each forecast quantile .- P1 contains the lower quantile forecast.
- P2 is the middle quantile (0.5).
- P3 is the upper quantile.
Notes:
- You can't use line items that are configured as summary items.
- You don't need to include P1 or P3 if you aren't interested in using the quantile results. If you don't include P1 or P3, the action won't fail.
- In Blueprint mode, format the line items as a number.
Example of a forecast results module: