The data insights modules contain insights about data in a given data collection. These modules are optional.
Create data insights modules
Here is a high-level summary of how to create the data insights modules:
- Create a list called Data Collection.
This list includes the names of the data collections you create in Forecaster. - Create a module for time and item-level insights.
- Create a module for item-level insights.
See the sections below for more information about Steps 2 and 3.
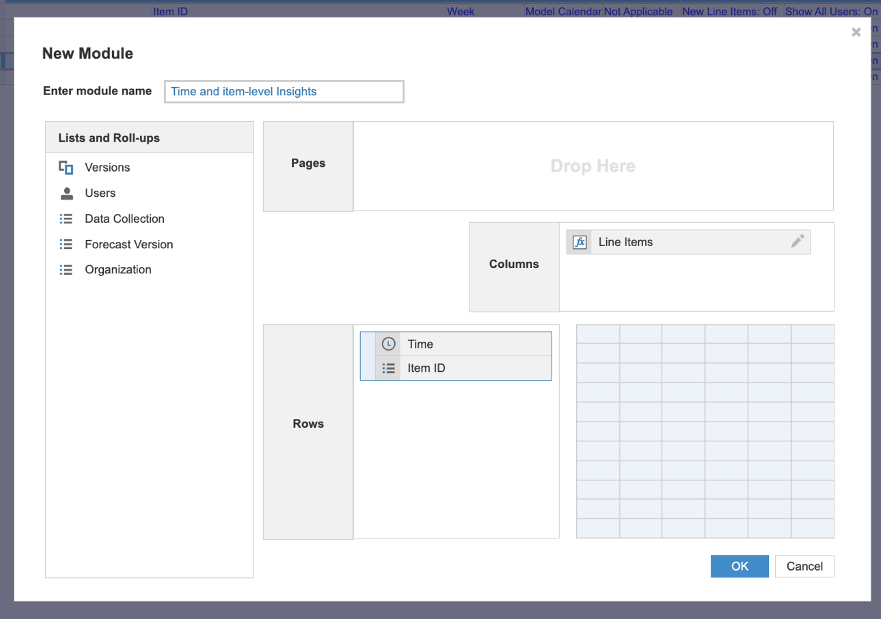
Create a module for time and item-level insights
Create a module for time and item-level insights with the components below. This module should be called Time and item-level insights.
The components are:
- Data collection list as a page selector.
- Time dimension as a row.
- The dimension should represent monthly, weekly, or daily data.
- The frequency of the data should correspond to that of the historical data.
- Item ID list as a row (the same list used in the previous modules).
- New line items as columns. Create the line items below and format their type in Blueprint mode as detailed below. All line items for this module are optional, you only need to include the line items that you are interested in viewing in Anaplan modules.
| Line item | Format |
Is_outlier | Boolean |
Is_changepoint | Boolean |
Seasonality_weekly | Number |
Seasonality_bi_weekly | Number |
Seasonality_monthly | Number |
Seasonality_quarterly | Number |
Seasonality_yearly | Number |
Trend_quarterly | Number |
Trend_yearly | Number |
Notes:
- You can't use line items that are configured as summary items.
- You don't need to include all the line items in the table. If you don't include some of these line items, the action won't fail.
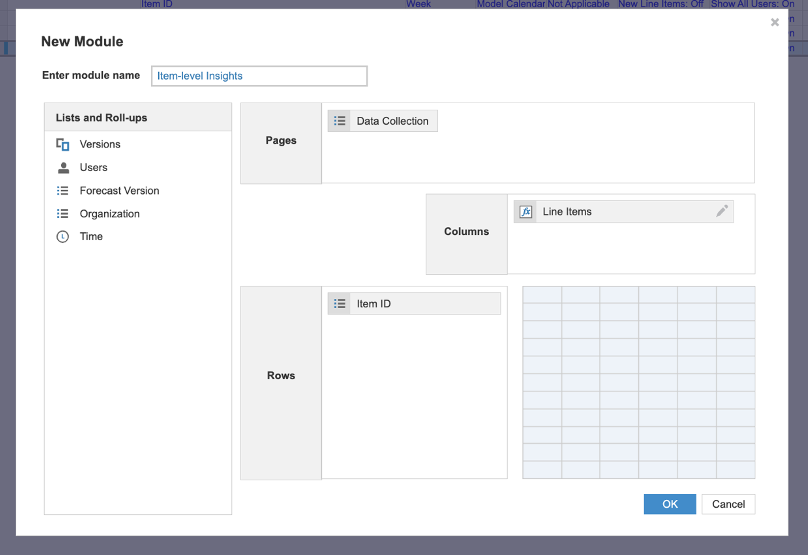
Create a module for item-level insights
Create a module for item-level insights with the component below. This module should be called Item-level insights. This module is identical to the previous one, except that it doesn't contain a time dimension.
The components are:
- Data collection list as a page selector
- Item ID list as a row (the same list used in the previous modules)
- New line items as columns. Create the line items below and format their type in Blueprint mode as detailed below. All line items for this module are optional, you only need to include the line items that you are interested in viewing in Anaplan modules.
| Line item | Format |
New_item | Number |
Obsolete_item | Number |
Stats_count | Number |
Stats_mean | Number |
Stats_standard_dev | Number |
Stats_min | Number |
Stats_25th_percentile | Number |
Stats_median | Number |
Stats_75th_percentile | Number |
Stats_max | Number |
Stats_percentage_total | Number |
Stats_skew | Number |
Related_data_line_item_name + (see the examples in the notes below) | Number |
Sparsity_percentage | Number |
Variability_type | Text |
Notes:
- For the correlation line items, only create these line items if related data was included in the data collection.
- Create a correlation line item for each related data item that you want to view correlation data.
- Replace any spaces in the name of the original related data line item with underscores and add the suffix
_correlationto create the corresponding line item name in the Insights item-level results module. - For example, if the data collection included a related data module with line items Promotions and Business Days per Month, the corresponding Insights module line item names would be as follows:
Promotions_correlationBusiness_Days_per_Month_correlation
- Replace any spaces in the name of the original related data line item with underscores and add the suffix
- You don't need to include all the line items in the table. If you don't include some of these line items, the action won't fail.
Example module setup
Example of an item-level, insights module setup.
Example of a time and item-level, Insights module setup.