Set options for dynamic charts.
Show columns and bars as cylinders: when ticked, column and bar charts are filled with a 3D effect
Missing values: Defines how the null source values are handled
- Plot missing values as zero: Plots the null values as if they were zeroes
- Don't plot missing values: Leaves a space where the null values are
- Interpolate missing values: Creates a value between neighboring values to plot
Line chart line width: The thickness of the lines for line charts.
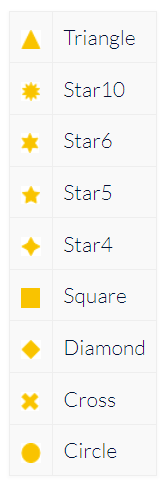
Marker style: For chart types that use them (for example, scatter charts), the shape of the markers:
Marker size: For chart types that use them (for example, scatter charts, dot charts), the size of the markers.

