Historical data is the primary data type used in a forecast, and the only required input for forecast models. It consists of numerical time series and represents the past observations of the target variable for the items you wish to forecast (example: weekly volume per SKU, sold in the past three years).
To create a historical data module:
- Create an item ID list with all of the items to forecast:
- Item ID list can be standard or numbered, and it could contain subsets.
- Item ID list must have a Code property that is populated for all items in the list.
- Item ID list should follow Anaplan recommendations for lists and codes.
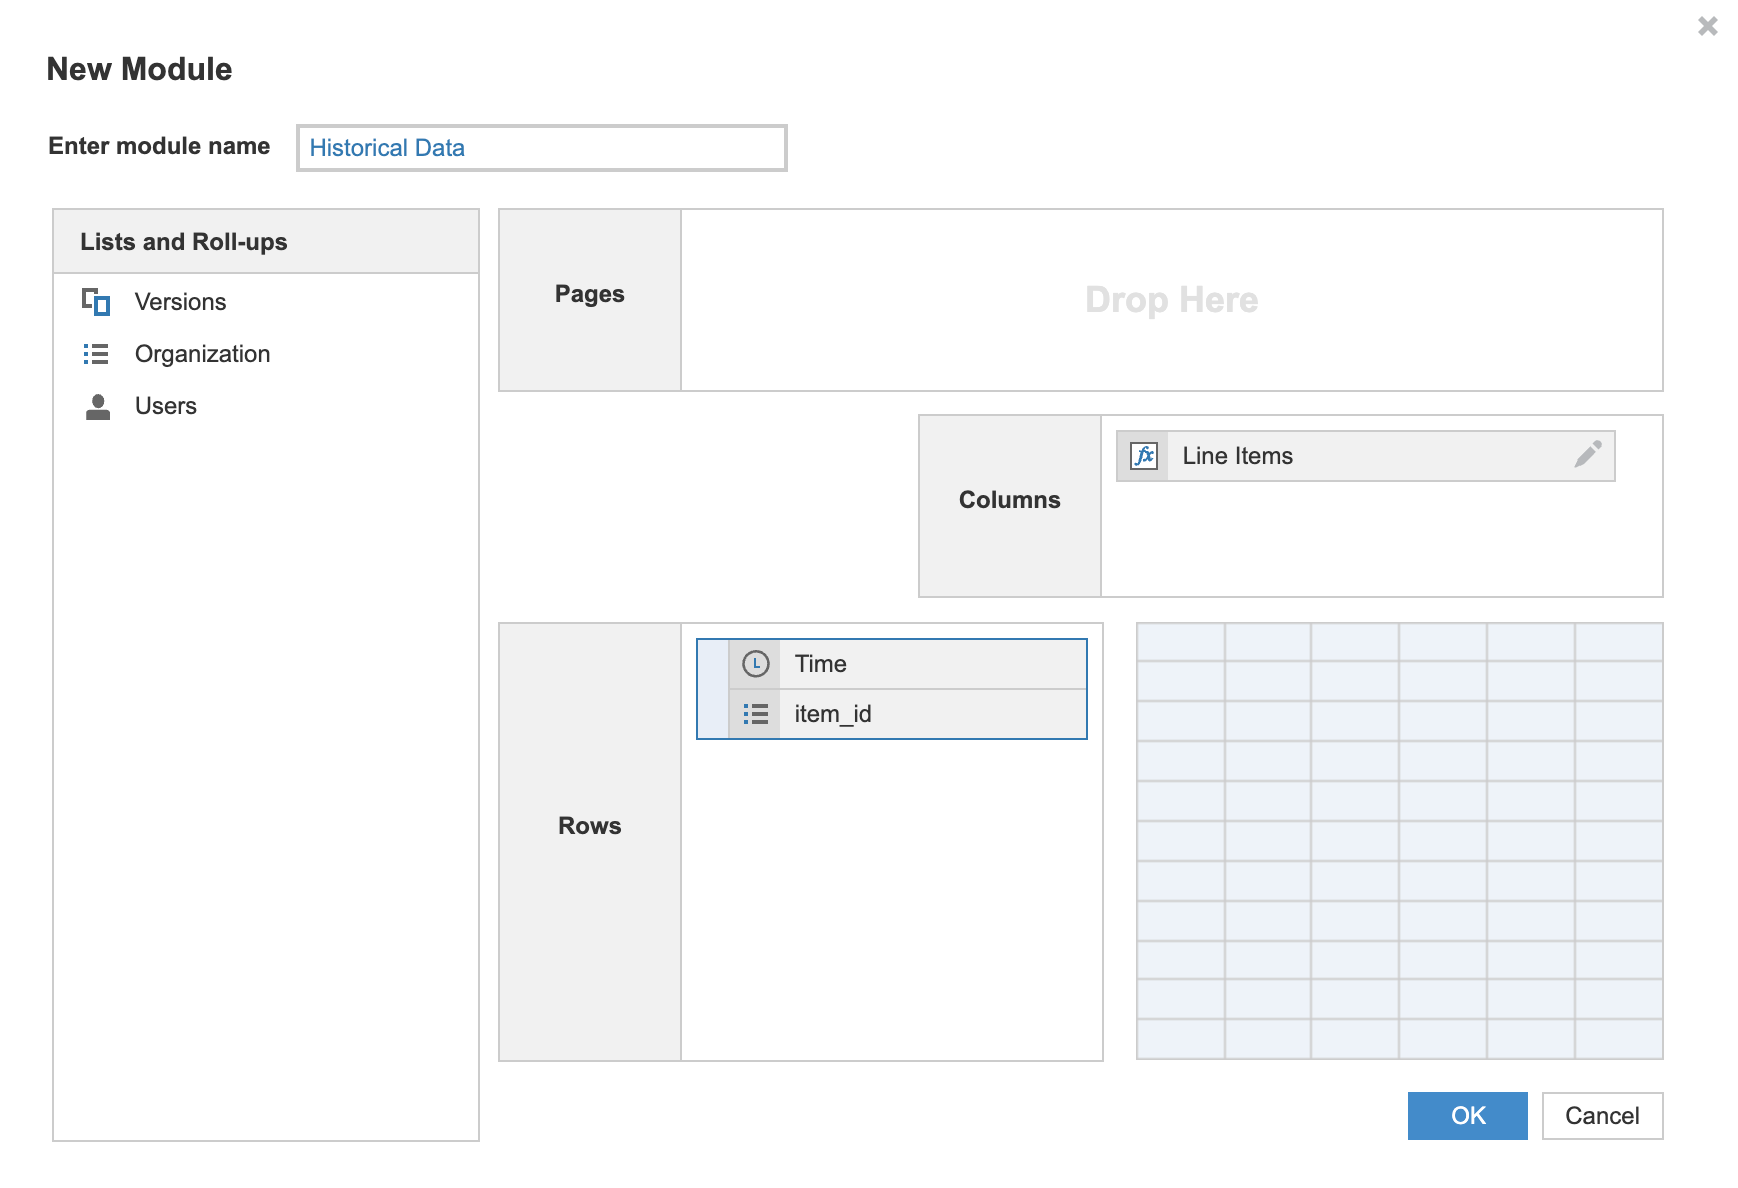
- Create a new module with three components:
- Time dimension as a row (represents monthly, weekly, or daily data).
- Item ID list as a row.
- New line item as a column:
- This new line item column is typically named to represent the forecast use case.
- Examples are Quantity, Revenue, Units Sold, or Demand, but the exact name is up to you.
- In Blueprint mode, format the line item as a number.
- You can't use line items that are configured as summary items.
- Import your historical data into the module and verify that the fields map correctly.
You can use the Exclude values option to replace undesired values in your historical data. See Exclude values for details.
Other optional data types
Next, you have the option to create more data modules (Related or Attribute data). The data from these modules may improve your Forecaster forecast results. You can also skip ahead to create data insights modules or create a forecast results module.

