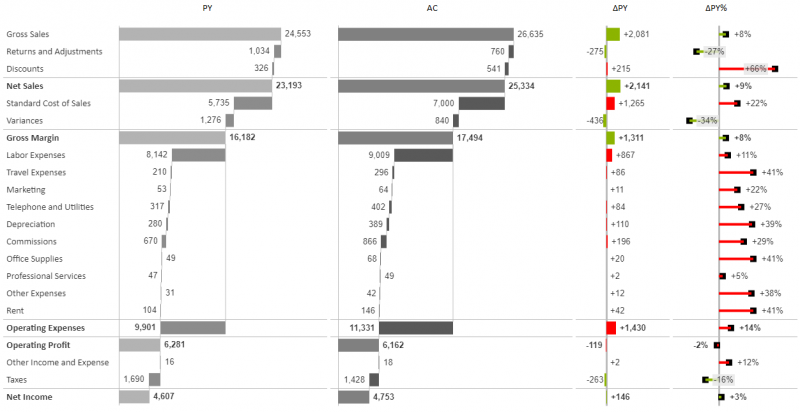
You can format variance charts.
Use the Formatting pane
Several formatting options can be set from the formatting pane.
Relative Variance
- Marker style: Set the marker size, shape, and whether it appears in front of or behind the lollipop line.
- Stick width: Change the width of the lollipop.
Integrated Variance
- Bar alignment: Set the variance bar at the start, center, or end of the base value bar.
- Bar width: Alter the percentage width of the variance bar.
- Arrow length: Make the variance bar appear with an arrow tip.
Match to
When showing many charts on one page, it's important that the scales on all of them match. This will keep the charts looking the same. This, of course, doesn't apply between charts plotting absolute and relative values. This can be done with the Match to' setting in the chart properties.


The absolute variance chart shares a scale with the waterfall charts. The relative variance chart doesn't share a scale with the waterfall charts. Learn how to create these charts in this tutorial.

