When selecting data to generate any type of chart, it's important to understand how zero values are handled.
Where line items have the type Number, Anaplan enters a zero into any field that is empty or contains a null value. Consequently, there is no way to differentiate between a system-generated zero and a data value of zero.
Formatting Zero
When formatting Number fields, in Blueprint, you have option to display zeros as Zero, Blank, or Hyphen. This is simply a display option. If you choose to display a Blank cell or a Hyphen, the cell will still contain a zero value.
All chart types will display zero values where:
- They are in between the first and the last values in a data set.
- The initial zero values in a data set.
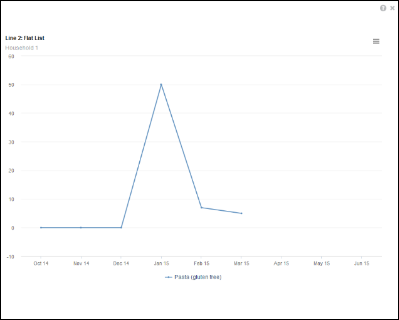
When generating a Line chart, where a series of zeros occurs at the end of a data set, the trailing zeros will not be displayed.
For example, when a line chart is generated from this selection:
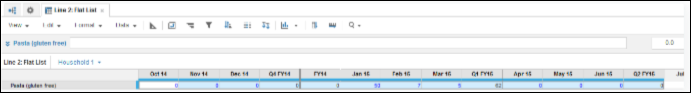
The chart displays the zeros at the beginning of the data set but does not display the zeros and the end of the data set:
If the design of the module supports it, you can use a very small value, applied via a conditional statement, to have the chart to display a near-zero value. For example:
IF value = 0 THEN 0.000001 ELSE value

