We're excited to have launched some great new features this month, including updates to the New Modeling Experience, more ways to speed report creation in Management Reporting, and the ability to better understand your data with PlanIQ.
Click here to see all the enhancements we made to Anaplan this month and to get a sneak peak at what’s coming next month.
Released in November
Planning & Modeling
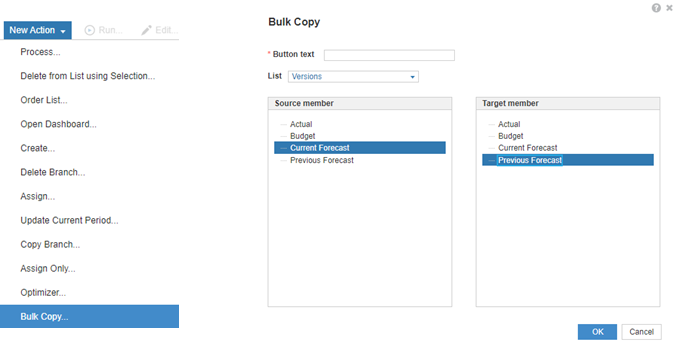
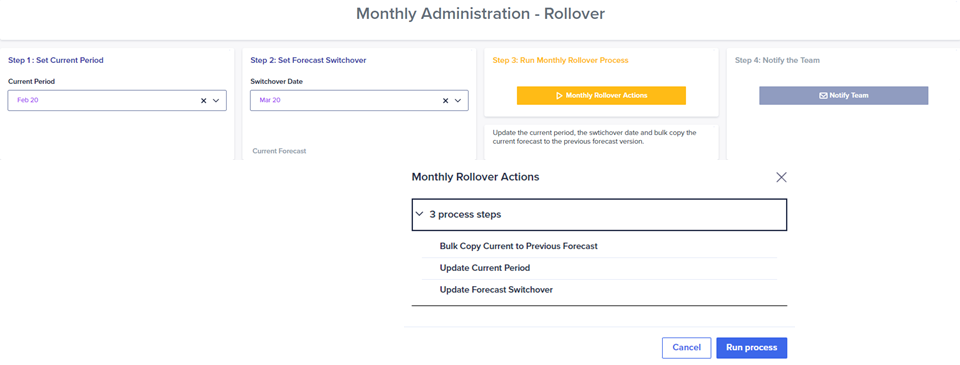
- Bulk copy action: Perform bulk copies across dimensions such as versions, time, or any non-production list with a pre-configured action. Quickly perform periodic rollovers or other common admin activities, by incorporating the bulk copy action into a new or existing process. You can include bulk copy in automated schedules, or trigger manually via UX pages or Classic dashboards. Note that this is available only for Workspace Admins to use with non-production lists.
You can watch a short demo video here
Explore the latest updates to the New Modeling Experience:
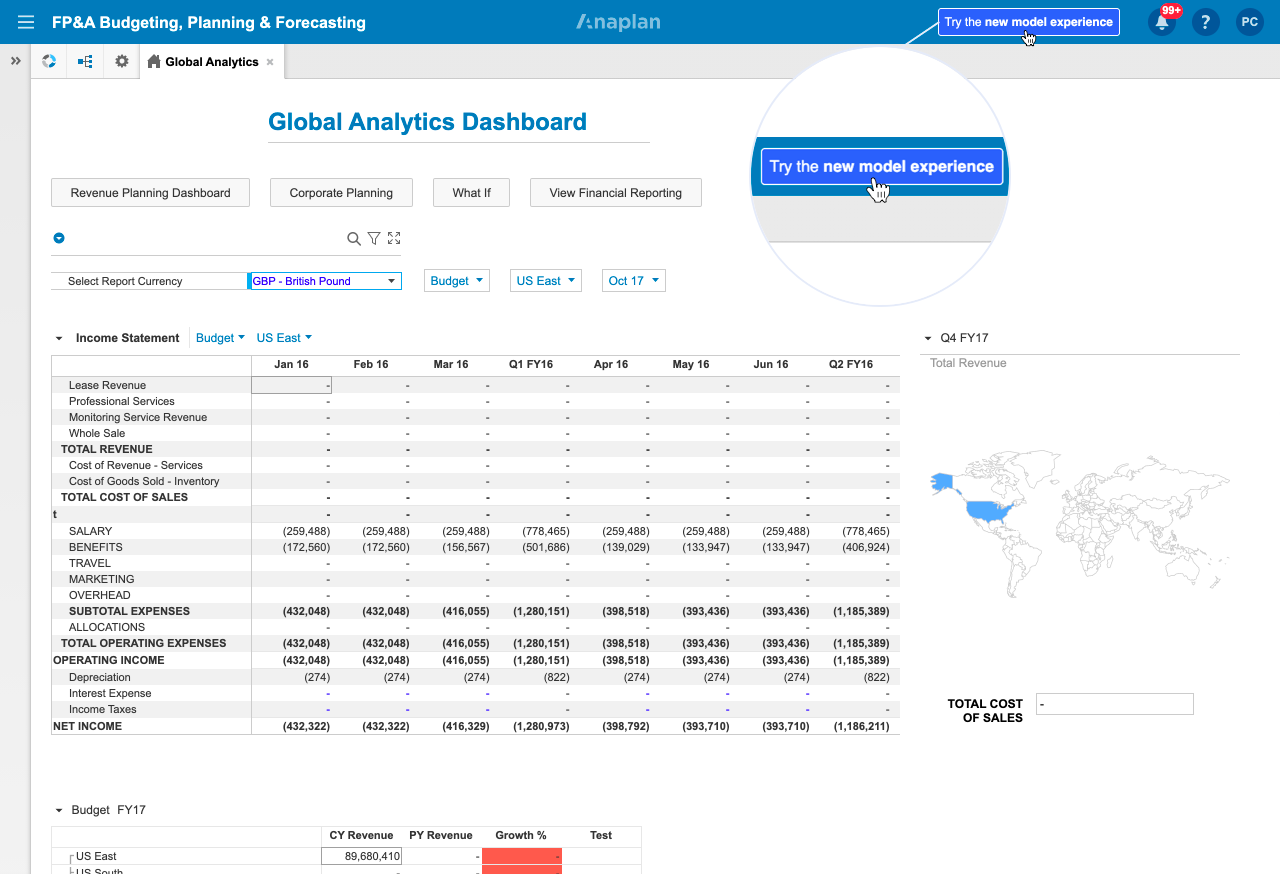
- Try the New Model Experience button: It’s now easier than ever for model builders and end users to navigate to and take advantage of the new experience. Simply click the button on the top right of your model to open it in the new experience.
You can watch a short demo video here
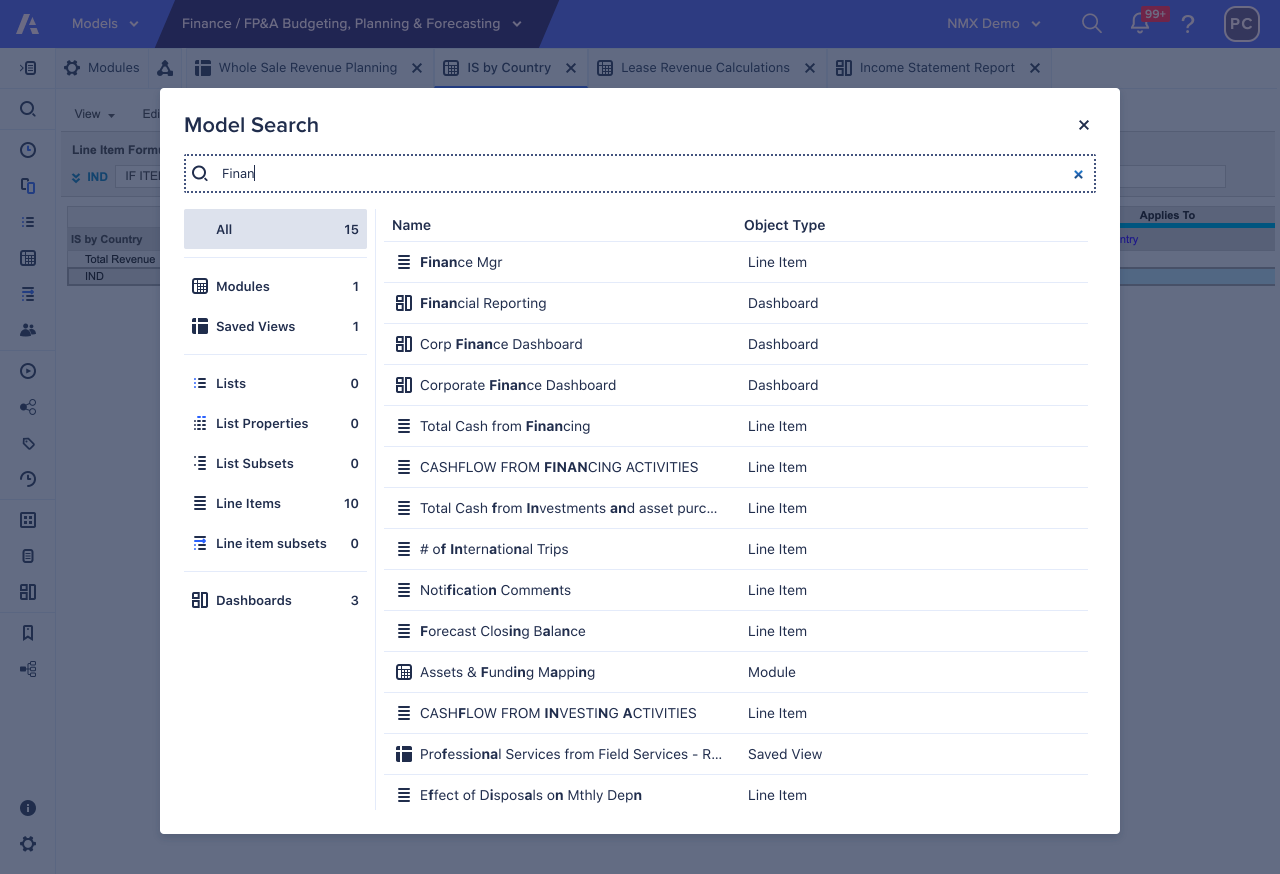
- Model object search enhancements: Search for line items, list properties, and list subsets in the model object search interface. Opening one will take you directly to that item in the corresponding object tab.
You can watch a short demo video here.
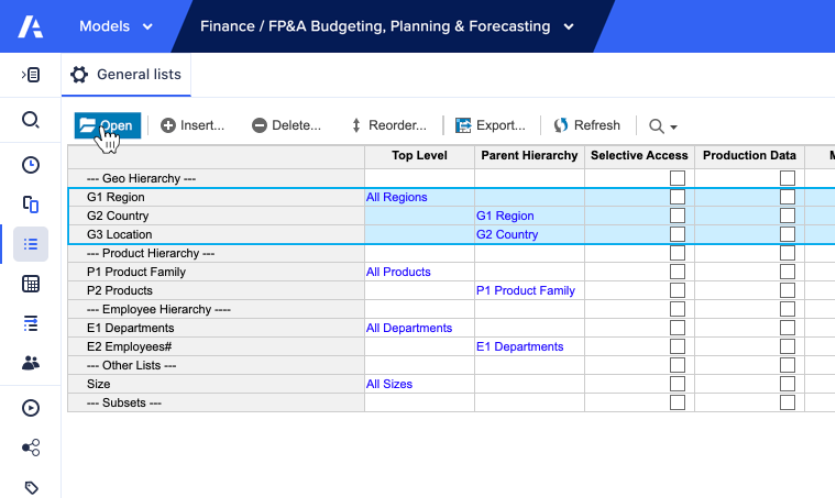
- Open multiple lists and line item subsets: Multi-select lists and line item subsets from the corresponding modeling screens and select to open them all at the same time. This is similar to the same functionality for modules and dashboards.
You can watch a short demo video here.
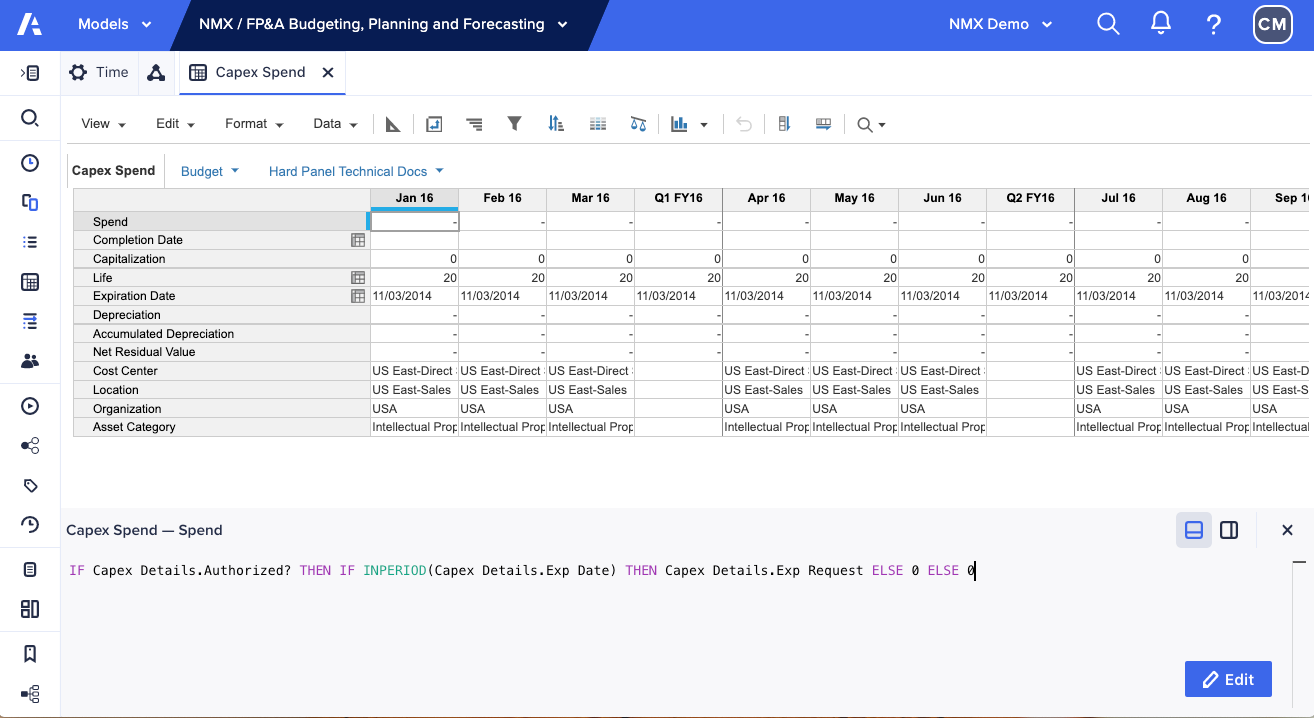
- Formula preview mode: Open and preview formulas in the new formula editor before choosing to edit them. Click between line items in preview mode to see formulas for different line items. Preview mode also supports the viewing of formulas in deployed models.
You can watch a short demo video here.
User Experience
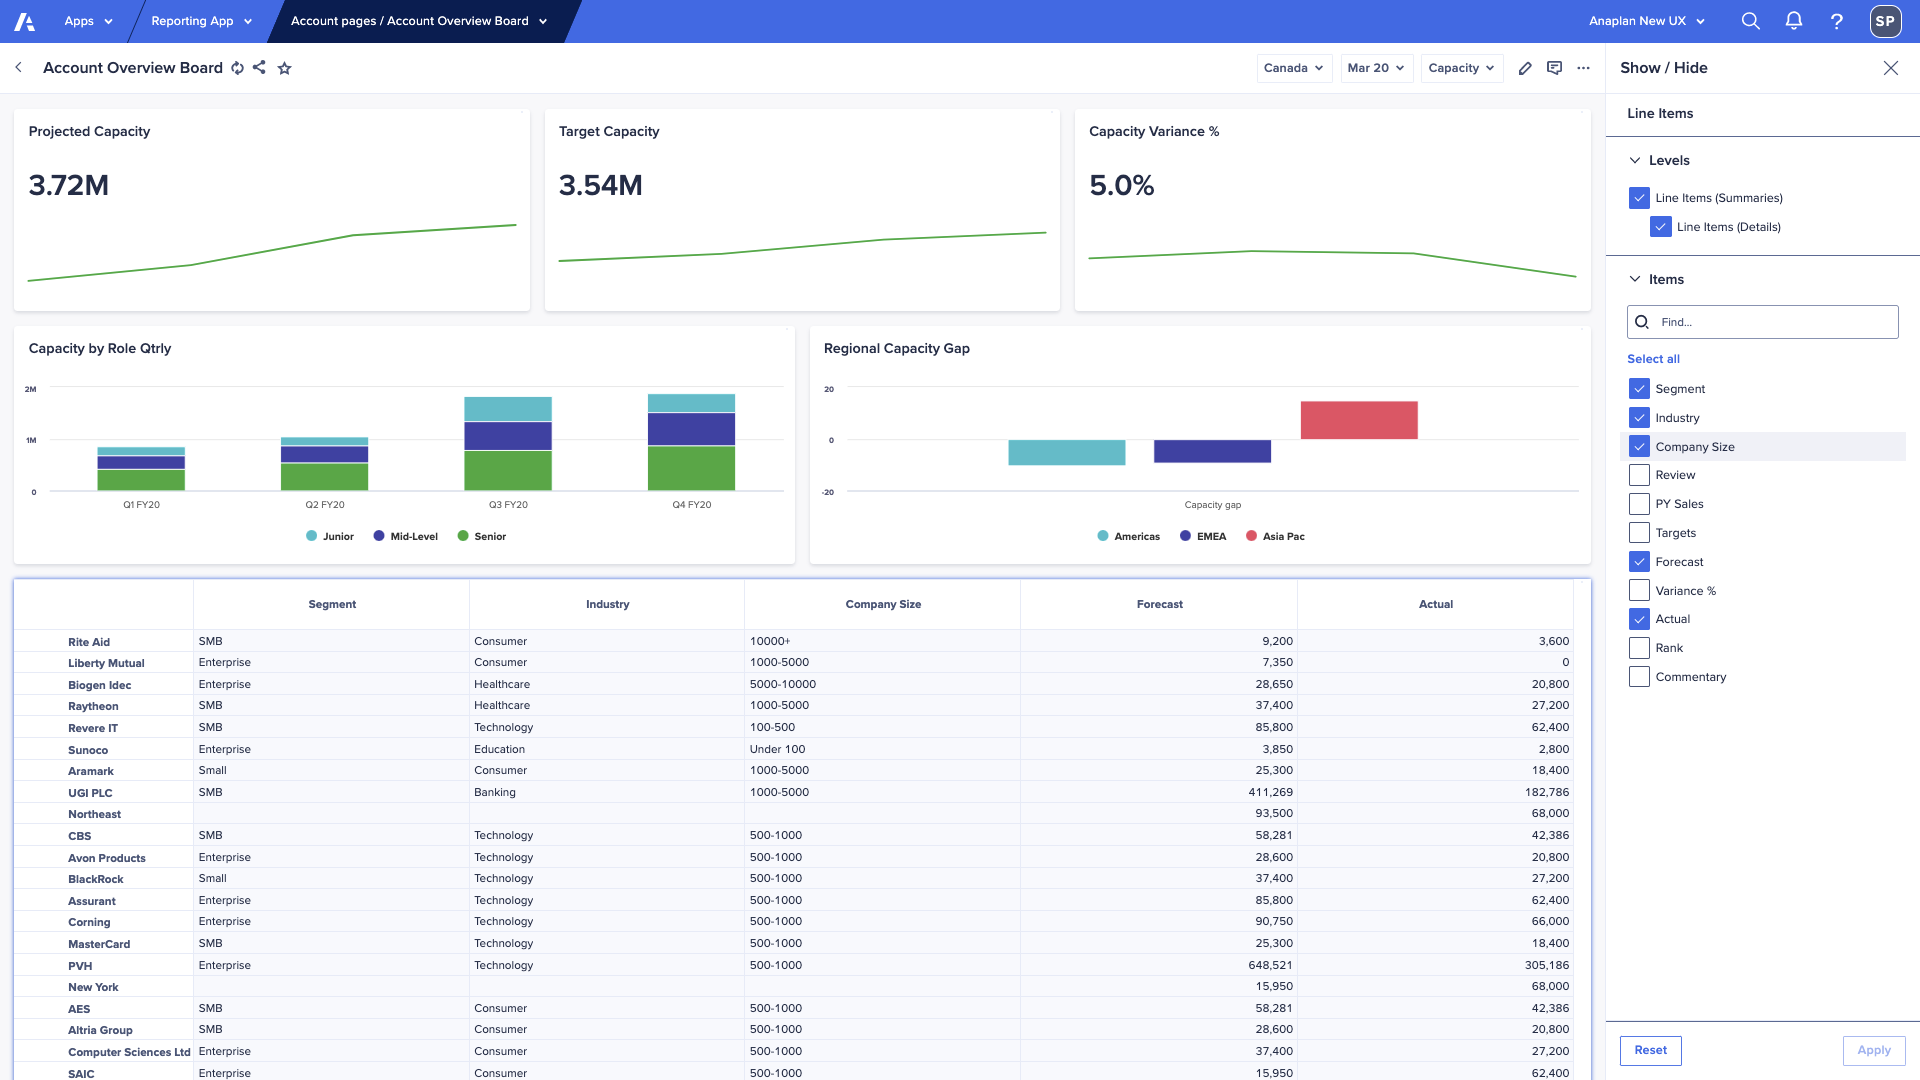
- End user show/hide: End users can now use the show/hide feature to select which rows and columns they want to see in their grids. This means they can focus on the data set that is most relevant to them. The show/hide feature is supported on all grid cards on boards and also those in the insights panel. This brings the grid card in line with the main grid on a worksheet. Any shows/hides applied to the grid are saved in the browser local storage and are carried over for that user across multiple logins via the same browser.
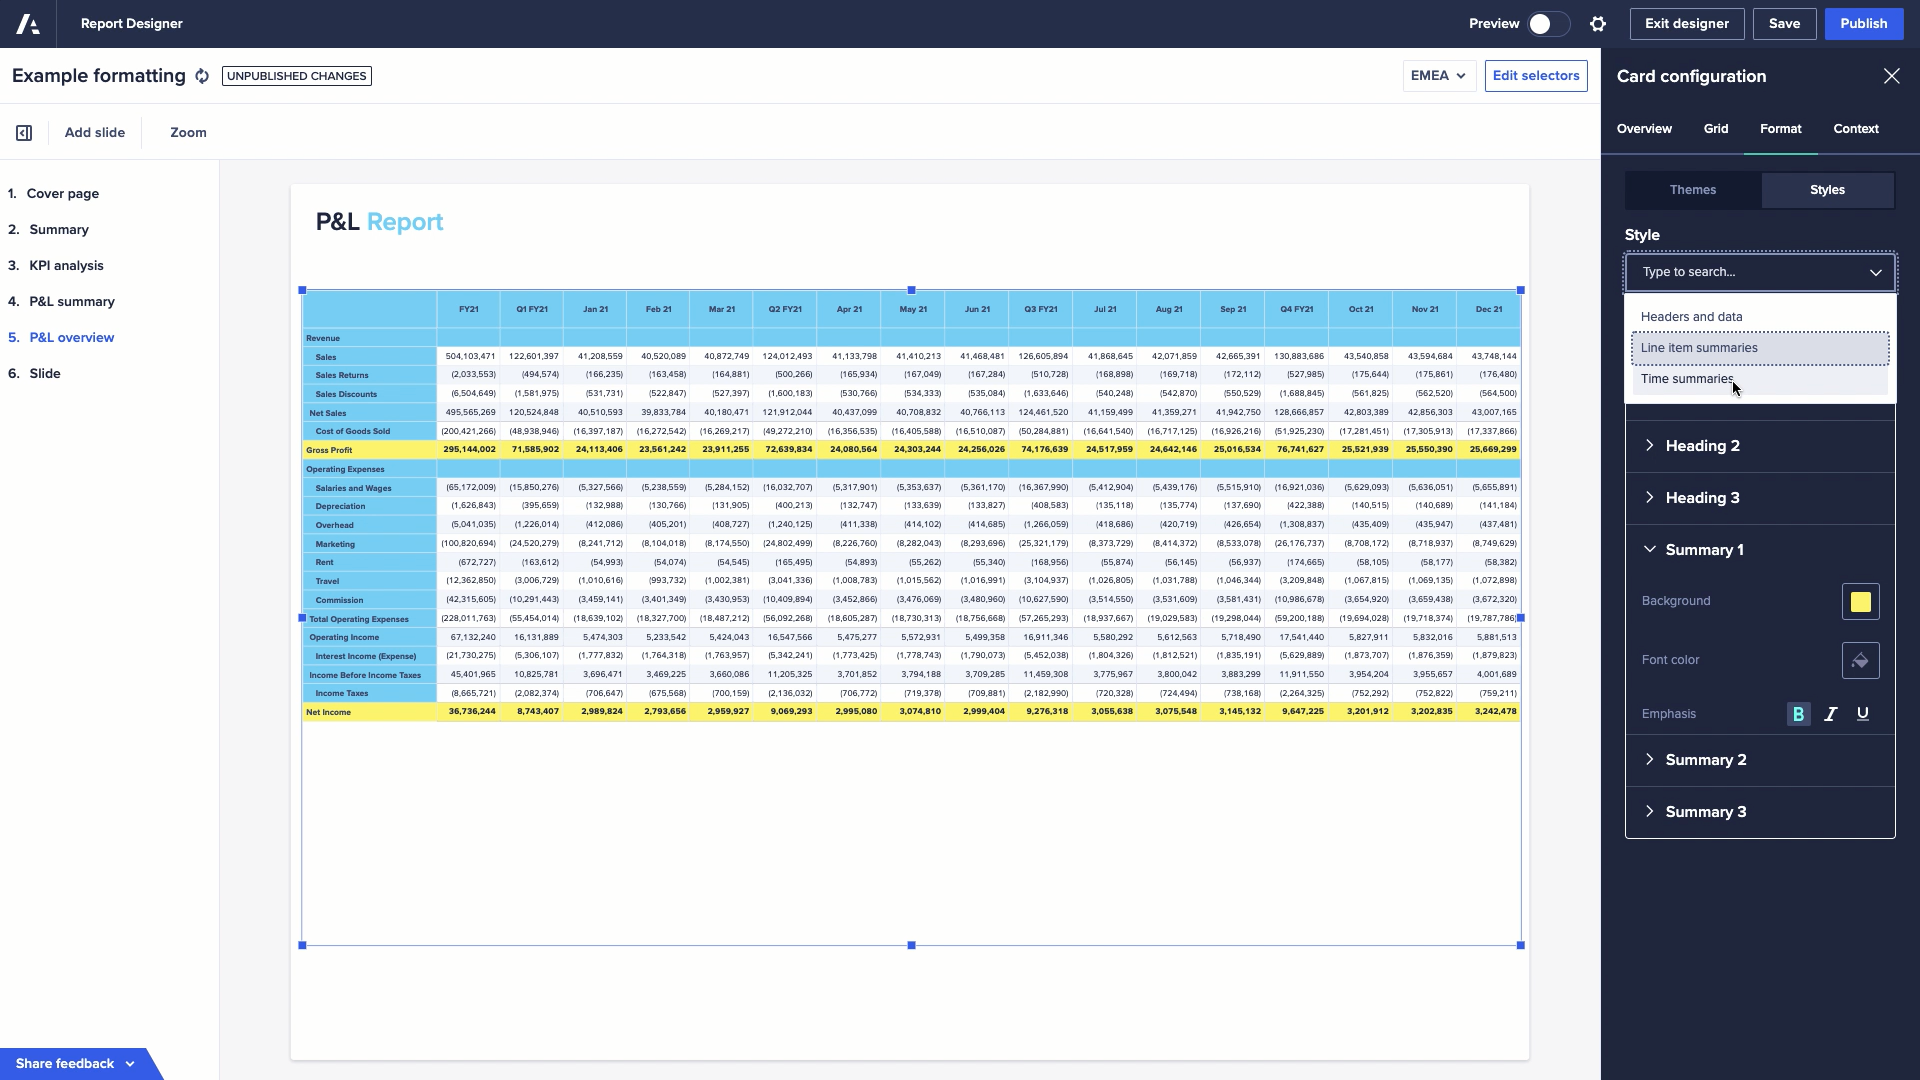
- Presentation table summary style formatting: Improve the look and feel of your reports with increased formatting options on the presentation table. Page builders can now style the table row and column headers, as well as time and line item summaries. This allows you to highlight or bold subtotals and totals or call out quarter or full year totals.
You can watch a short demo video here
- Card templates: Create consistent reports even faster with card templates, which are now supported in the report page. Users can now save a chart card template on a board and use it on a report page.
- Presentation mode selectors: It's now even easier to switch between your region, product, or report period on presentation mode. The new collapsible tool bar enables you to change the context of the slide you’re presenting.
You can watch a short demo video here.

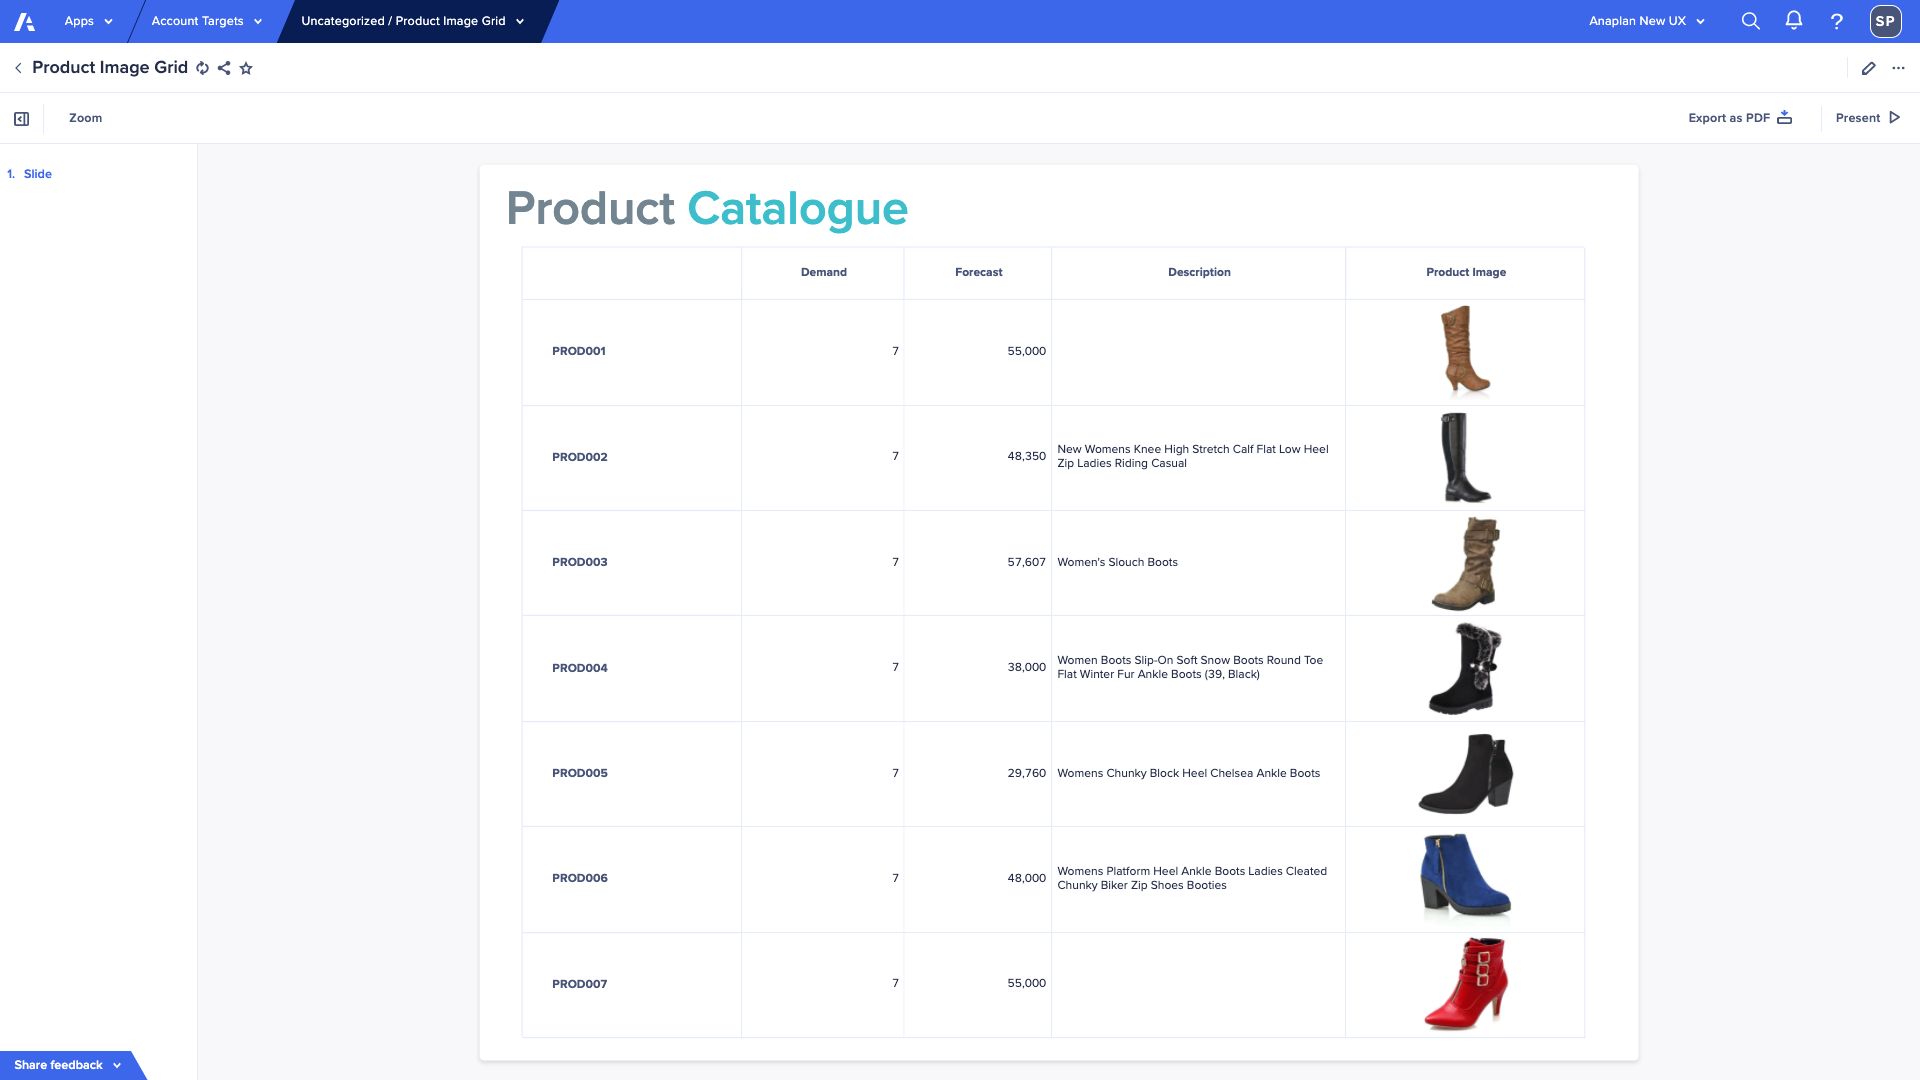
- Presentation table grid image support: You can now include images within your table on the report. These images can be used to represent products or status.
You can watch a short demo video here.
Intelligence
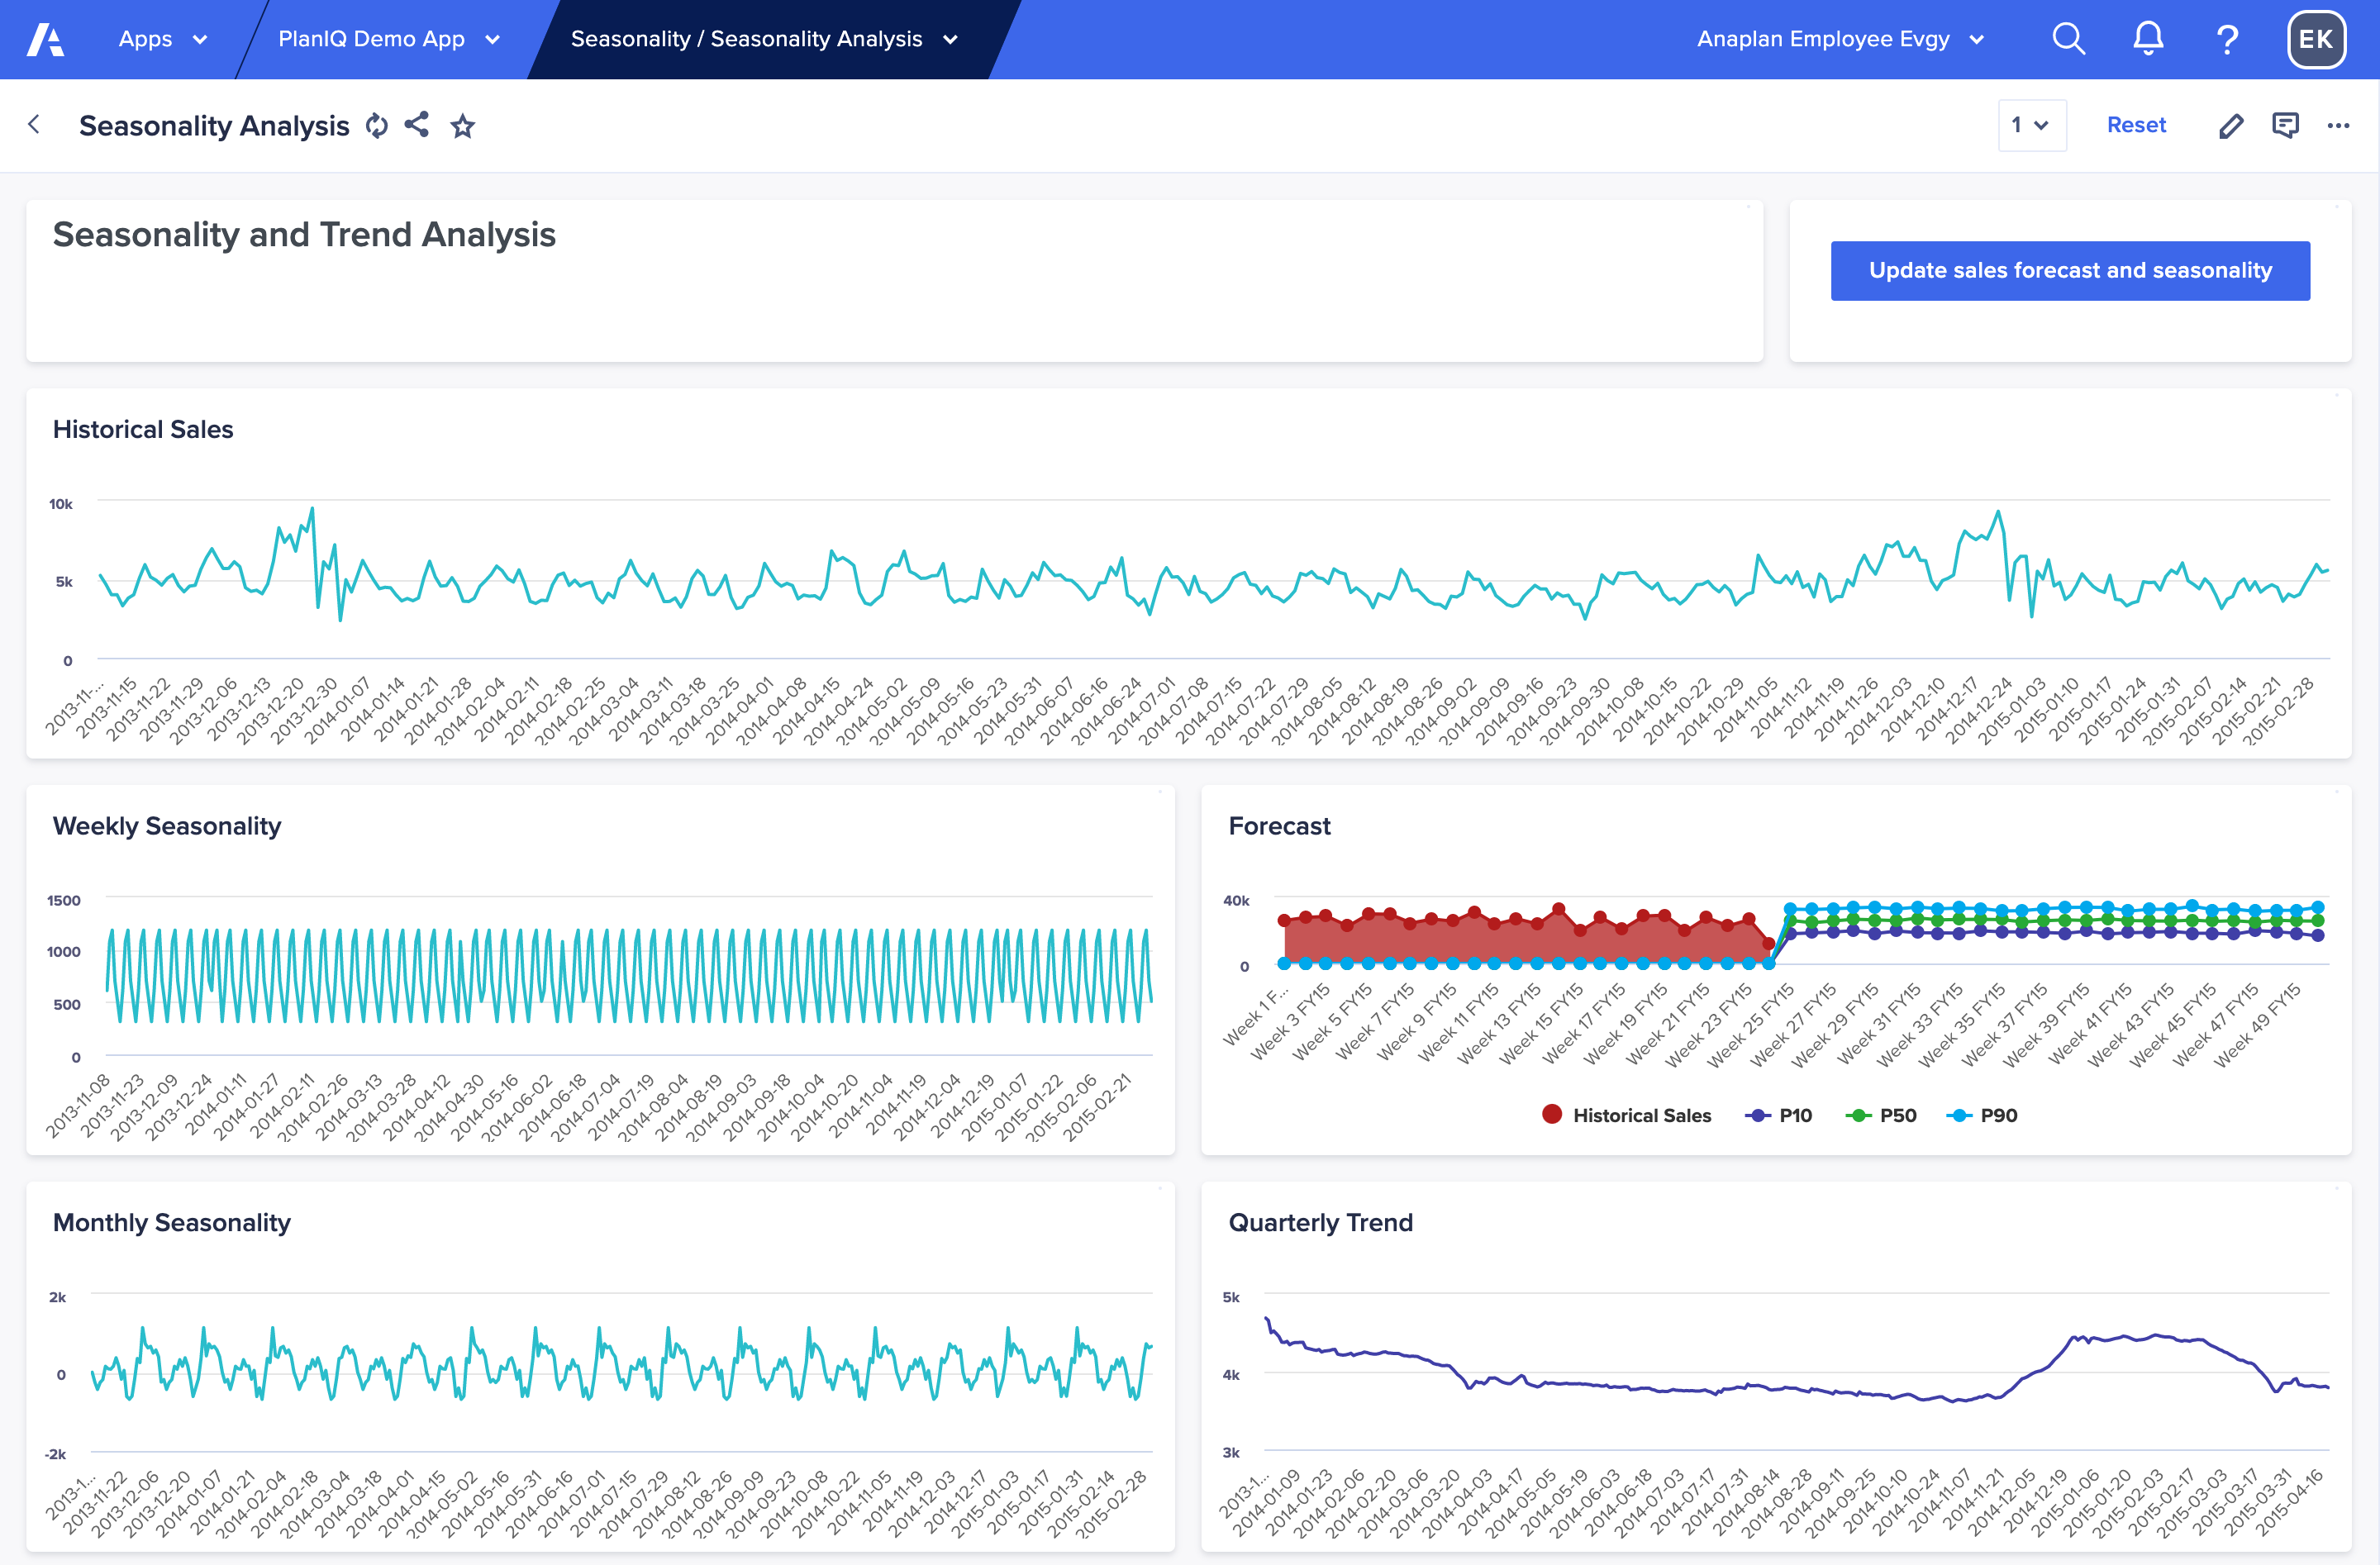
PlanIQ: Prepare better for the future with embedded intelligent analysis:
- Seasonality and trend analysis, and backtest results: These new PlanIQ features give you a better understanding of your data and improve forward-facing plans. For more information on how they work, please see this release blog post.
Optimizer updates:
- Optimizer’s advanced linear optimization algorithms allow customers to find optimal solutions to complex problems with just the click of a button. Users can now use Optimizer to solve even more complex problems with these three updates to the product:
- Test and iterate on optimization problems faster to find better solutions for more complex problems by choosing the percentage of optimization required for your problem.
- Solve even more complex problems with extended time boundaries.
- Gain deeper understanding of how Optimizer worked on your problem to run more effective programs.
Targeted for December
Disclaimer: Please note: The information here is subject to change right up to release go-live time. This post is not a commitment to provide any features by a certain time frame and enhancements to the product may change before release. Subscribe here and check back frequently for the latest.
Customer product webinar
- Plan-Analyze-Act: Put your best plans forward in 2022: Join us December 7, at 8 a.m. PST for our final customer product webinar of the year! We’ll share some of the latest and upcoming platform enhancements and explore how they can help advance your planning and gain more in-depth analysis.
Have questions or looking for an update? Stay in touch:
- Stay up to date with upcoming downtime releases at status.anaplan.com
- Review all of our scheduled platform maintenance windows in the Release calendar

