
Learn about new Anaplan features and enhancements introduced in September 2026.
User Experience
KPI cards
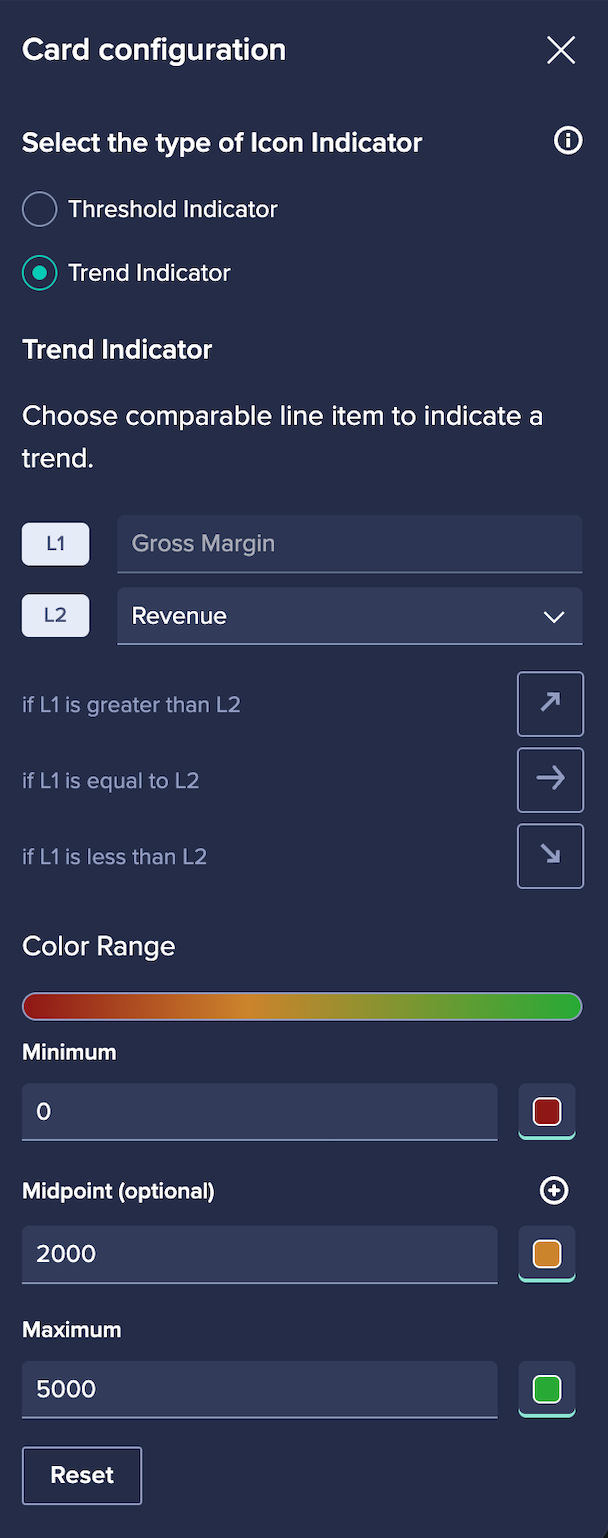
We’ve updated KPI Cards in the UX. Page builders can now configure conditional formatting on KPI cards to dynamically change the Value (text color) and/or display a variety of status and trend Indicators (icons) based on the KPI’s underlying value. This enables page builders to design visually compelling dashboards.
By adding conditional text coloring and directional icons, stakeholders can instantly scan dashboards, spot performance anomalies, and identify critical trends without digging into dense grids or separate charts. This improves visual hierarchy, improves user engagement, and drives faster, data-informed decision-making.
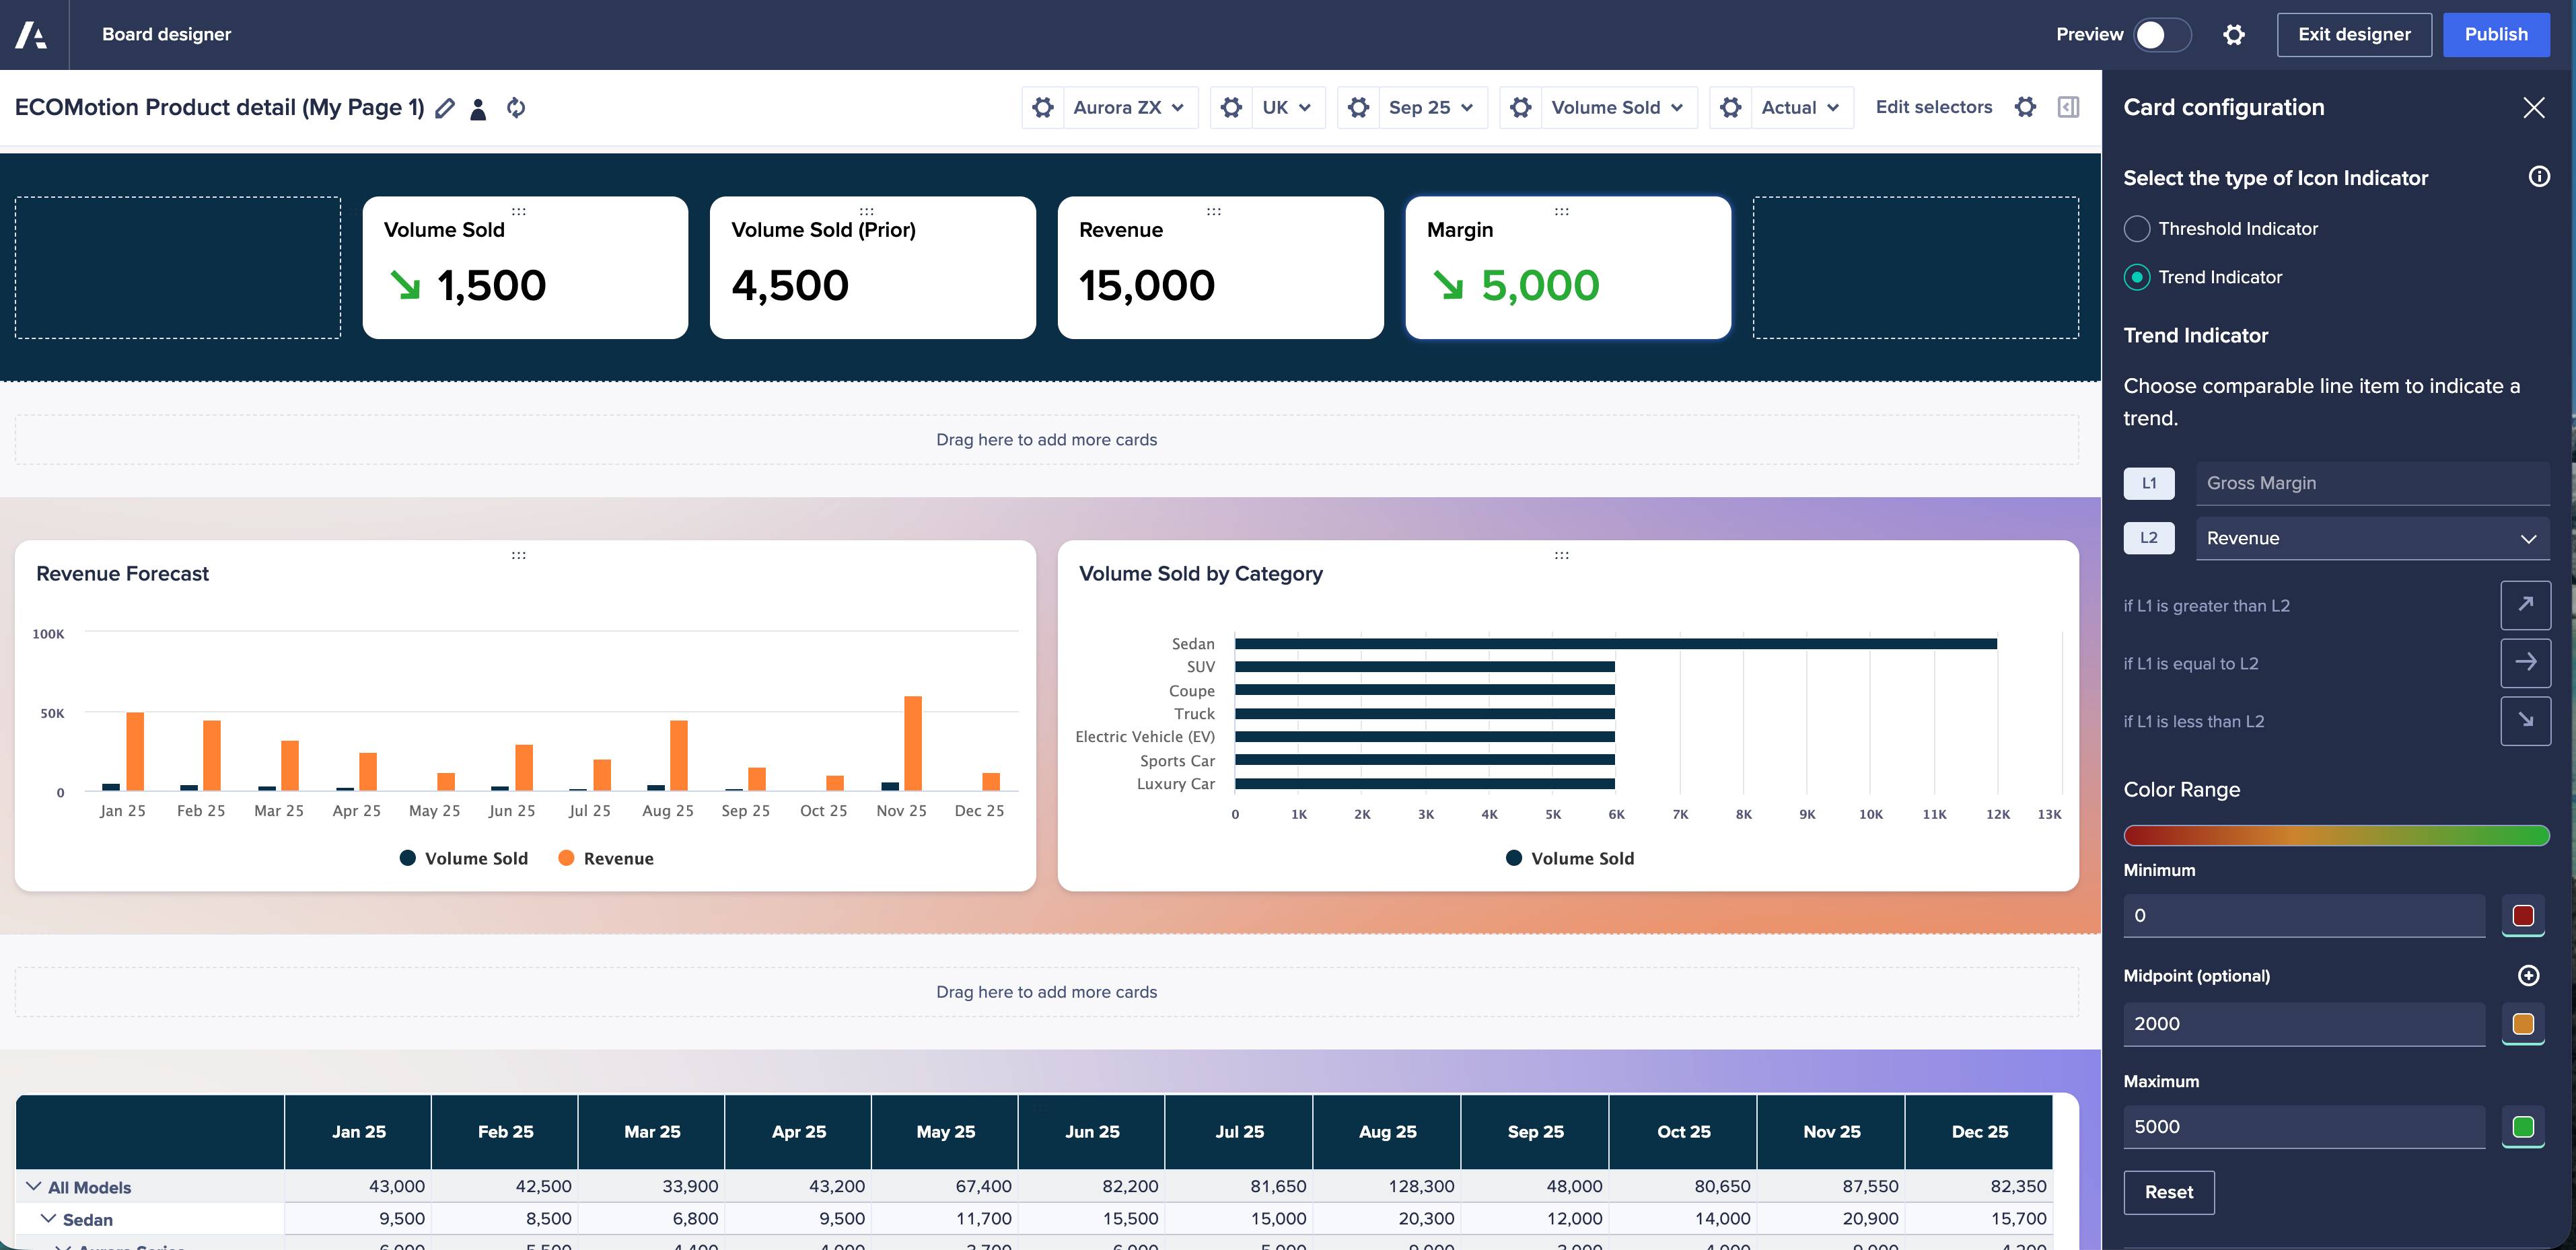
Threshold Indicator: easily set up ranges to track performance against specific targets or limits (such as Red-Amber-Green status):
- Threshold Color Selections: Configure a color range with Minimum, Midpoint (optional), and Maximum values. Choose colors using the standard Anaplan palette or enter custom Hex codes (for example,
#8F1616) to align with your brand standards. - Threshold Indicator Selections: Choose from a rich library of 15+ different status shapes to represent status visually.

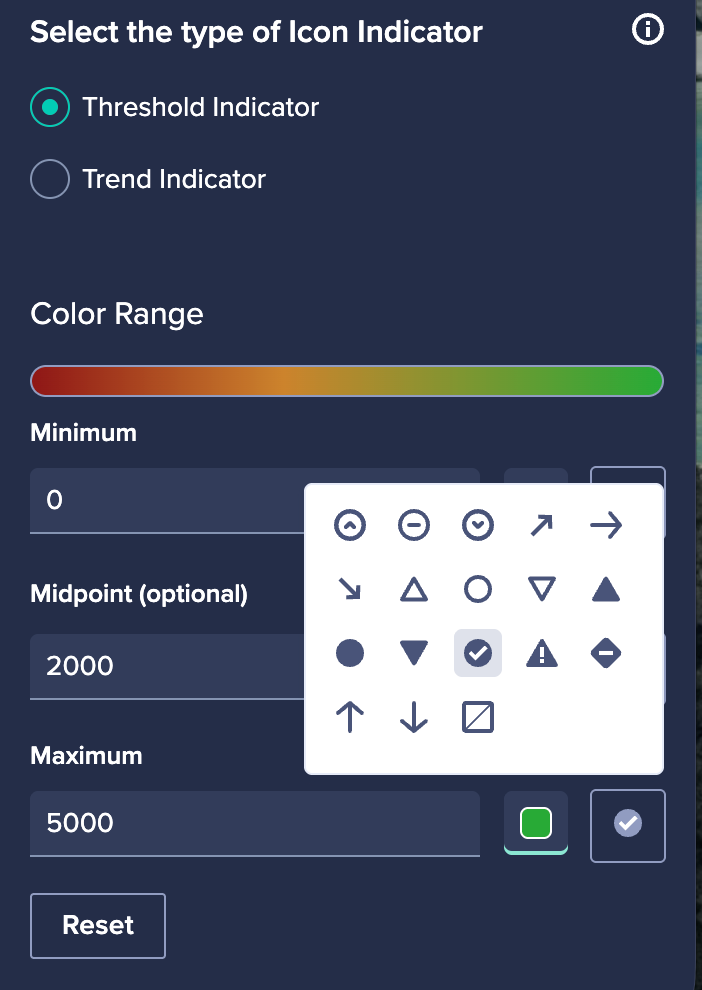
Trend Indicator: Display visual momentum directly on your KPI cards. Page builders can select a trend arrow based on:
- Based on a Second Line Item: Compare your primary KPI line item (
L1, for example, Gross Margin) against a secondary line item (L2, for example, Previous Gross Margin). Define custom trend rules and corresponding icons for when:L1is greater thanL2(for example, up-right arrow)L1is equal toL2(for example, right arrow)L1is less thanL2(for example, down-right arrow)

Learn more in:
Mobile
Zoom and pan
Reviewing detailed planning data on mobile devices is now easier with zoom-and-pan support:
- Zoom into any mobile page to enlarge small text, dense tables, and detailed visuals.
- Drag or swipe across the canvas to view content beyond the current viewport while zoomed in.
KPI Conditional formatting
Users can now view KPI cards that display the new conditional formatting trend and threshold indicators on mobile.
Intelligence
CoModeler
Show AI assist in model history
CoModeler assisted actions are now fully visible in the standard Anaplan model history. This enables you to have complete audit trails and greater transparency for AI-assisted actions within your models.

Enhanced CoModeler’s ability to add and edit views and lists
Saved views
get_saved_views: Query and retrieve full saved view configurations (pivots, filters, sorting, and more) either across the entire model or targeted to specific modules.edit_saved_view: Modify existing saved module views by dynamically adjusting filters, selections, display settings, and dimensional perspectives.add_exports_from_saved_view: Create new export actions directly from your saved module views, allowing you to extract filtered, highly specific datasets on the fly.
Subsets
add_list_subsets: Instantly spin up new list subsets within your models to create focused, dimensional views from larger parent lists.edit_list_subset: Modify existing subsets on the fly—updating configurations, parent list references, and filtering criteria effortlessly.
List improvements
rename_list_items: Rename list members while preserving all existing references and downstream functionality across the model.update_list_notes: Dynamically update and maintain list documentation, making it easy to capture business rules, usage guidelines, and data sources for seamless knowledge transfer.
Analyst
Anaplan Analyst is a secure, generative AI assistant, built into Anaplan, that helps planners make faster, more confident decisions and take action. We’ve made enhancements to Anaplan Analyst:
Move from asking what happened to understanding why it happened
Analyst automatically investigates the drivers behind your metrics by doing causal and diagnostic analysis and runs live calculations grounded in Structured Query Language (SQL), to provide new metrics and analysis.
No manual configuration
When enabled for an App, a fully scoped and secure agent is automatically provisioned. Deploy powerful analytics to your users, with no extra work required.
Learn more in:
- Anaplan Academy:
- Anapedia:
Optimizer
Retries
To improve reliability during peak usage, Optimizer will automatically retry server requests. This helps reduce disruption caused by temporary delays or high server load, providing a smoother experience for users.
Disclosure Management
Refreshed user interface
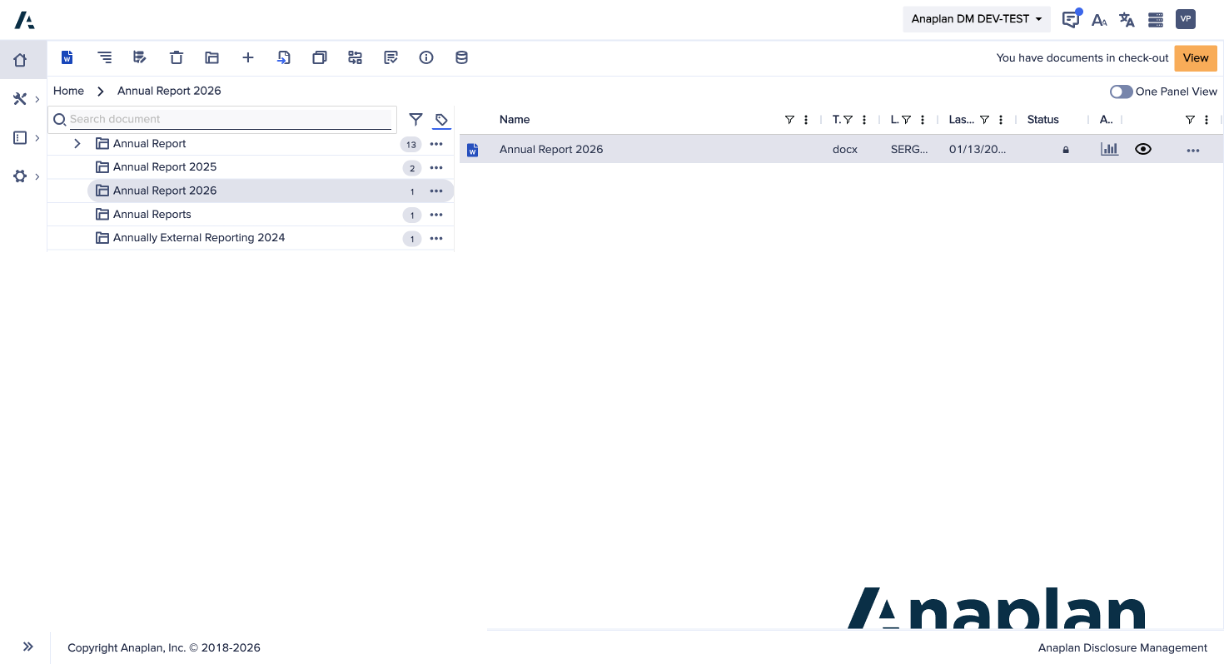
We’ve redesigned the Disclosure Management interface:
- Refreshed icon set: Menu and header icons now match the icons used across Anaplan, for a more consistent experience.
- Tooltips on hover: Icon descriptions have been moved from static labels to tooltips, simplifying the menu while keeping information one hover away.
- Streamlined Home navigation: The Home icon in the left bar is now the single way to return to the homepage. Duplicate Home icons have been removed from the View, Structure, and Data Source menus.
- Improved breadcrumbs: Breadcrumb navigation on documents and data sources has been improved, making it easier to navigate through folders.
- Updated user impersonation UI: The interface for the user impersonation feature has been improved.
- Multi-tenant dropdown selector: Customers with multiple tenants will see a dropdown selector for the tenants they have access to.
Simplified menus with tooltips reduce clutter without losing accessibility. Simpler Home navigation and improved breadcrumbs make it easier to move through documents, data sources, and folder structures. For customers managing multiple tenants, the new dropdown selector makes it easier to switch between them. This keeps the experience consistent with the rest of the Anaplan platform, so teams can stay focused on their disclosure workflows rather than on navigating the platform.
Anaplan Data Orchestrator
ADO pipelines
- Oracle: Pipelines can be created and configured with Oracle as a source to import into ADO datasets or models. Pipelines can be set to write back from ADO data to tables in Oracle. They can also be used to update the data on-demand or scheduled using Workflow.
Learn more in Create an Oracle writeback pipeline. - Snowflake: Pipelines can be created and configured with Snowflake as a source to import data into ADO datasets or models directly. This extends Snowflake as a source for other pipeline features such as adding data validation and removing duplicates.
Learn more in Create a Snowflake writeback pipeline. - Salesforce: Pipelines can be created and configured with Salesforce as a source to import into ADO datasets or models. Pipelines can be configured to write back from ADO datasets to Salesforce. They can also be used to update the data either on-demand or scheduled using Workflow.
- SFTP: Pipelines can be created and configured with SFTP as a source to import data into ADO datasets or models directly. Pipelines can be configured to write back from ADO datasets to an SFTP server. They can also be used to update the data either on-demand or scheduled using Workflow. Learn more in Create a PostgreSQL writeback pipeline.
- PostgreSQL: Pipelines can be created and configured with PostgreSQL as a source to import data into ADO datasets or models directly. Pipelines can be configured to write back from ADO datasets to PostgreSQL. They can also be used to update the data either on-demand or scheduled using Workflow. Learn more in Create a PostgreSQL writeback pipeline.
Pipelines support decryption of PGP-encrypted data through file-based connectors
File-based connectors can now handle PGP-encrypted files when sourced through a pipeline. This is available for all file-based connectors:
- Azure Blob
- GCS
- S3
- SFTP
Encryption detection: ADO automatically identifies that an incoming file is PGP-encrypted by looking at its filename extension (suffix), specifically looking for .pgp or .gpg.
Extension stripping and file type resolution: If detected, ADO strips the encryption suffix from the filename to reveal and uses the underlying file type (for example, converting sales_data.csv.pgp to sales_data.csv, or handling a compressed sales_data.csv.gz if it was zipped before encryption).
Asymmetric decryption:
- Encryption: External systems should encrypt the data file using Anaplan's public PGP key (which is publicly hosted and downloadable at the provided URL).
- Decryption: Only Anaplan's Data Orchestration service can decrypt this file, using the corresponding private key securely stored and managed within ADO. This ensures that the data remains highly secure and confidential while in transit.
Anaplan XL Reporting
General enhancements
- The Web Explorer folder pane can now be pinned so it stays visible while you work. The pinned folder will stay there even wherever you navigate.

- Recent connections now save to Settings immediately when used, not only on exit.
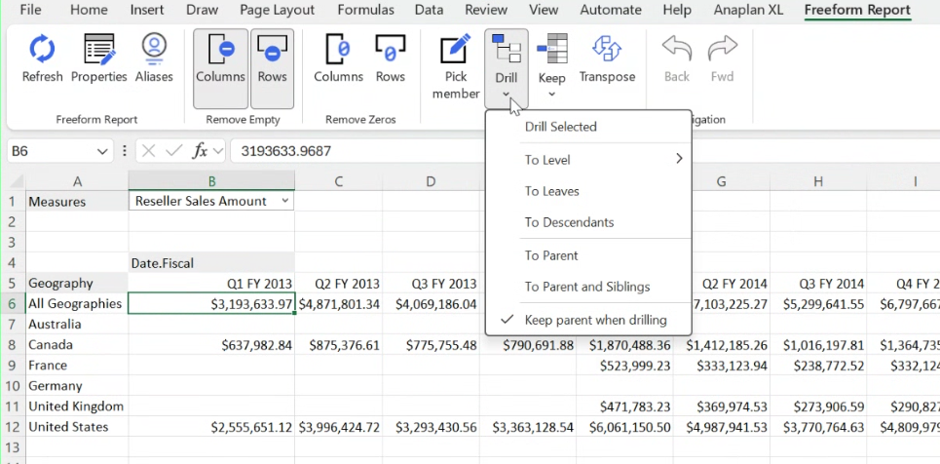
- Freeform reports now support multi-select drilling, which means you can drill on multiple selections across rows and columns. You also have the option to keep parent members. In the Drill option in Freeform Report ribbon, you can now see the Keep parent when drilling option, which is selected by default. Deselect it to hide the parent when drilling down.
- Submit All now runs a scan before submitting when deferred scanning is enabled.
- This release also includes a range of stability and usability fixes across web reporting, writeback, and chart rendering. This ensures a smoother and more reliable user experience.

