You may find the need to add a calculation based on a grid that isn't contained within the cube data. Anaplan XL Reporting provides various methods for adding calculations.
Different methods for adding calculations include:
- Grid Calculations
- Grouping members
- MDX Calculations
- MDX formula wizard
This tutorial presents several examples of creating calculations within a grid.
Difference between two members
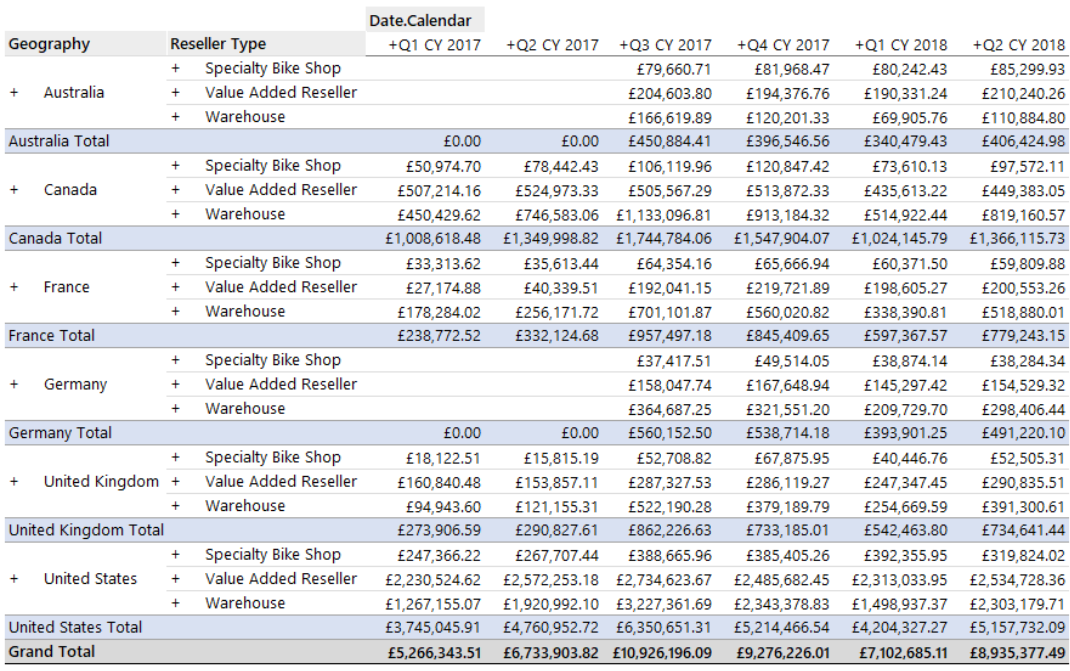
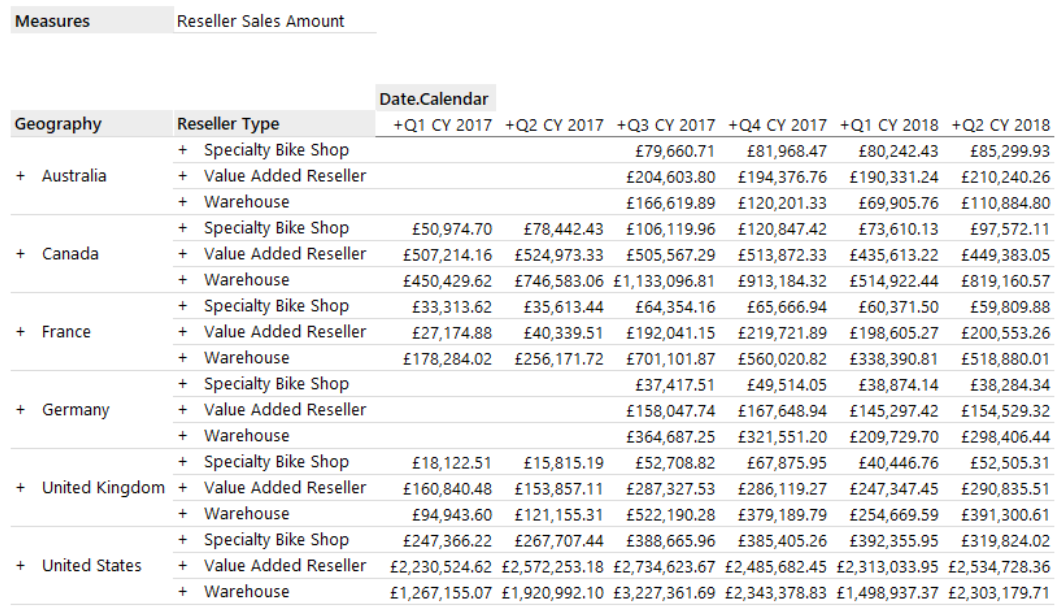
Consider the grid below, which shows the Reseller Sales Amount across various Calendar Quarters. Add a calculation which shows the difference between the values in Q3 and Q4 in 2017.
Select the Q4 CY 2017 column header. In the Anaplan XL Grid, select Column Calculation (or use the right-click menu Anaplan XL > Add Calculation).
A new column will appear to the right of the currently selected column. Overtype the default Calc title to the desired title. In any of the value cells in the calculation column, type the relevant formula. In this case, F7 – G7.

This formula is then propagated down all rows, even when drilling. If the position of the hierarchies is changed, the calculation remains pinned to the Q4 member. In the example below, the Date hierarchy has now been moved on to rows. The Change calculation appears wherever Q4 CY 2017 does.
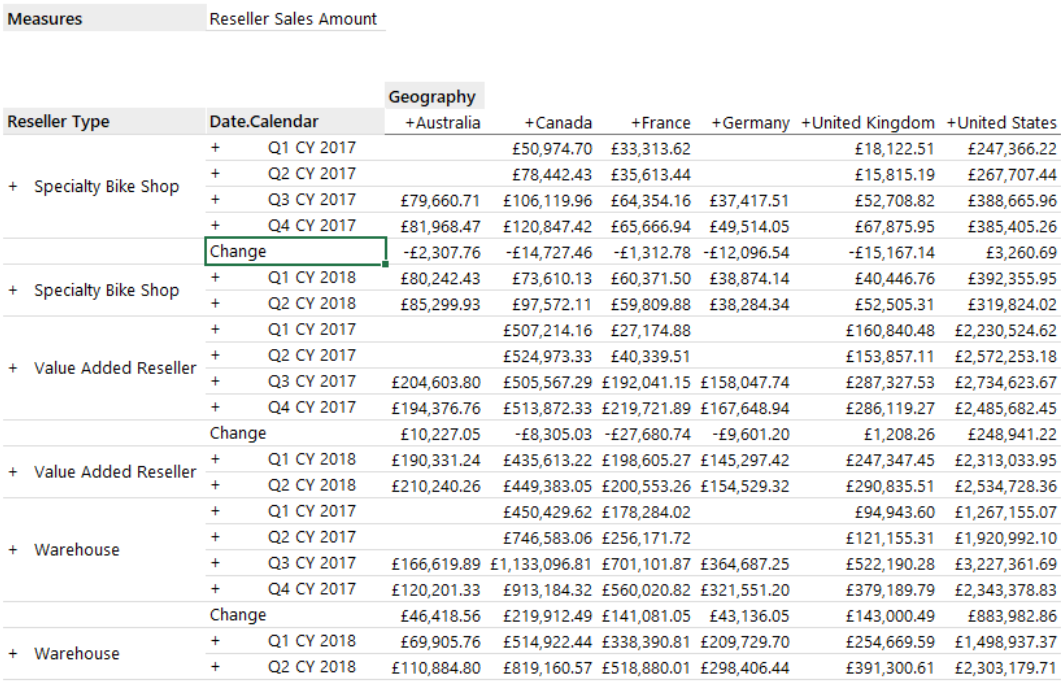
If the Q4 CY 2017 member no longer appeared in the grid, then the calculation would also not be visible.
Referencing other rows
Cell references to cells inside the grid will be converted to a reference to the relevant column member. The reference is to that column, not the row member.
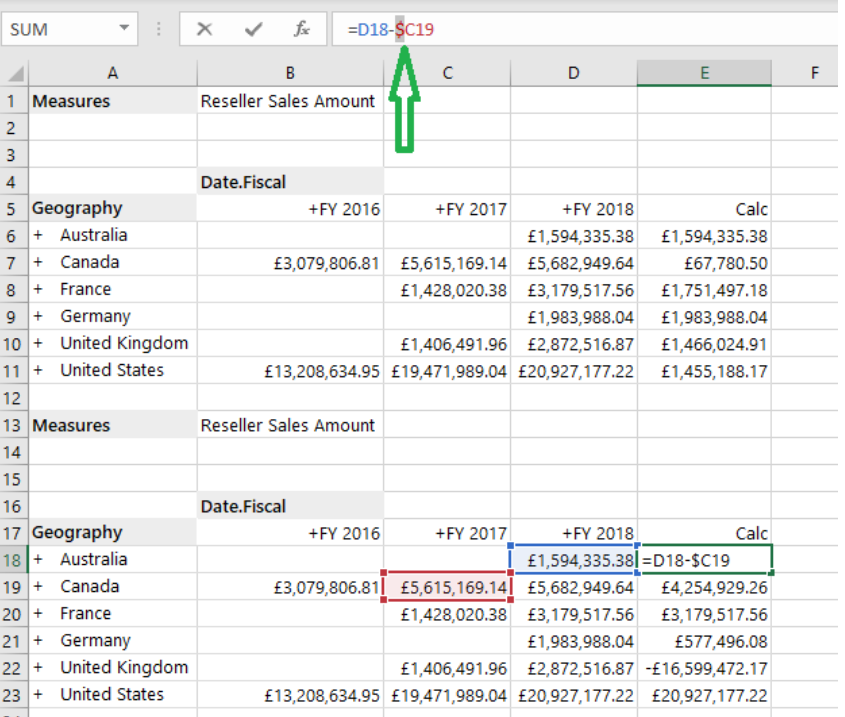
If you need to refer to another row, you can do so by dollaring the cell reference. This'll make the reference an Excel range reference and fill it according to the standard Excel rules.
This example shows a delta calculation. In the second grid, the reference is dollared so that it refers to the row below the current cell.
Fixed position totals
We want to show a calculation that always goes to the last member in the grid, no matter what members have been chosen. This is always the last row or column.
Using Fixed Position Grid Calculations
To do this, create a row calculation using the same method as before.
Double-click on the calculation title to open Edit Grid Calculation. Select Insert at End. Here you can select whether the calculation should be attached to the hierarchy or the axis.
The calculation now appears at the end of the Geography and Reseller hierarchies. If a member is drilled into (in this case, Canada), the calculation stays fixed to the bottom of the rows.
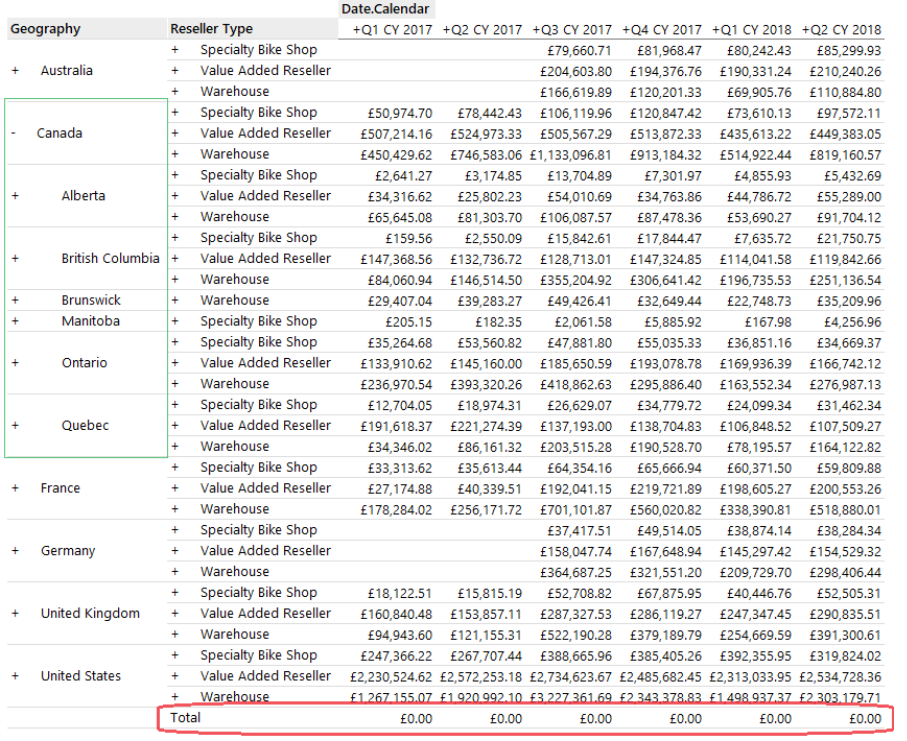
Any formula can be used in this calculation depending on the need. For the case of a total, just summing a regular Excel range won't give the correct value if the grid is drilled into. Instead, there are a couple of approaches to consider:
Retrieve the value for the All member with an XL3Lookup
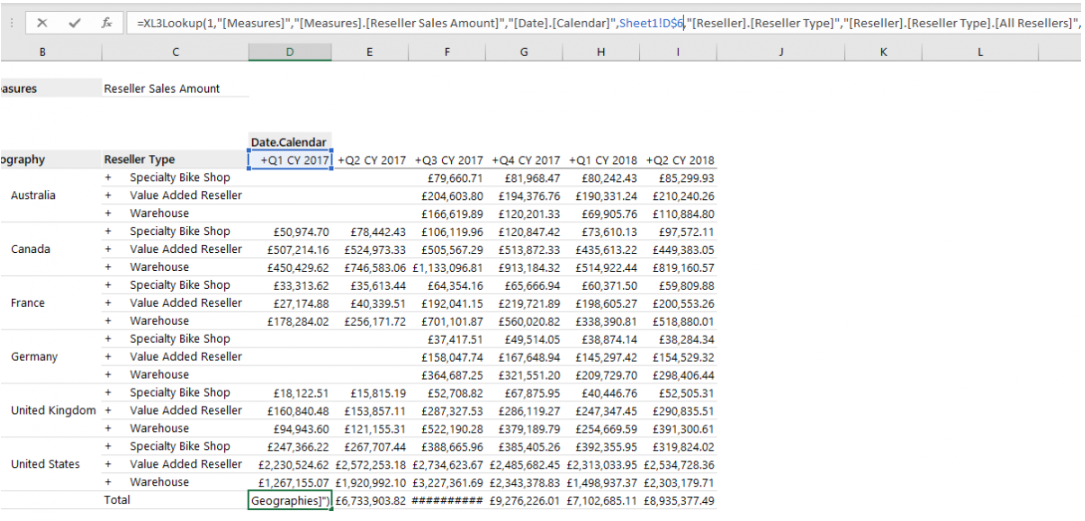
Consider using an Anaplan XL Formula - in particular, the XL3Lookup, to return the All member. This formula has a helpful wizard, which can be accessed through Anaplan XL > Insert Formula > Value.
Select the All member for the Reseller and Geography hierarchies. The calendar selection will be dependant on the column, so make sure the formula uses the correct dollaring.
Calculate the sum over each column in a named range
A different approach would be to create a named range for the grid and a sum across each row/column.
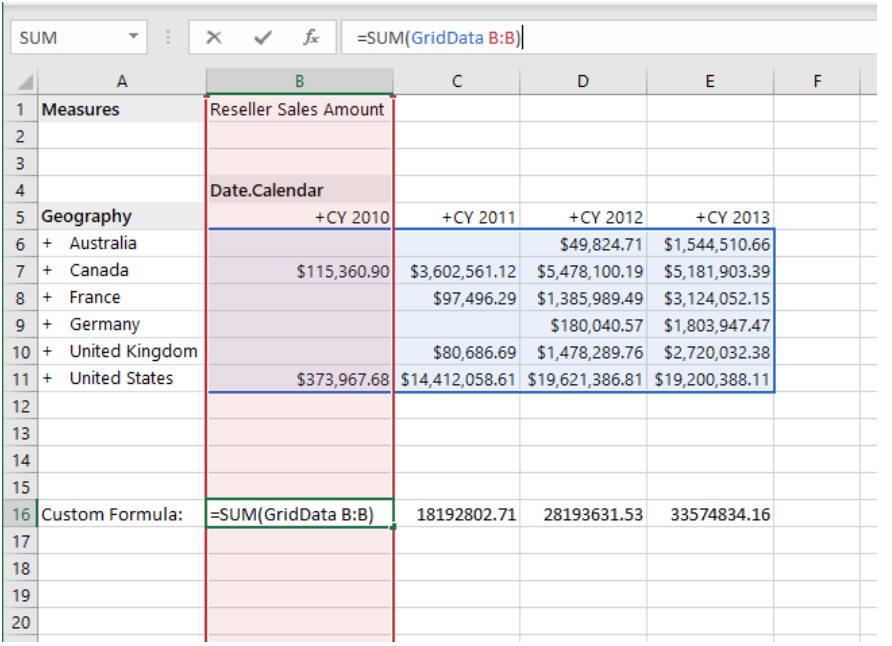
Apply formatting to the calculation to create a finished report.
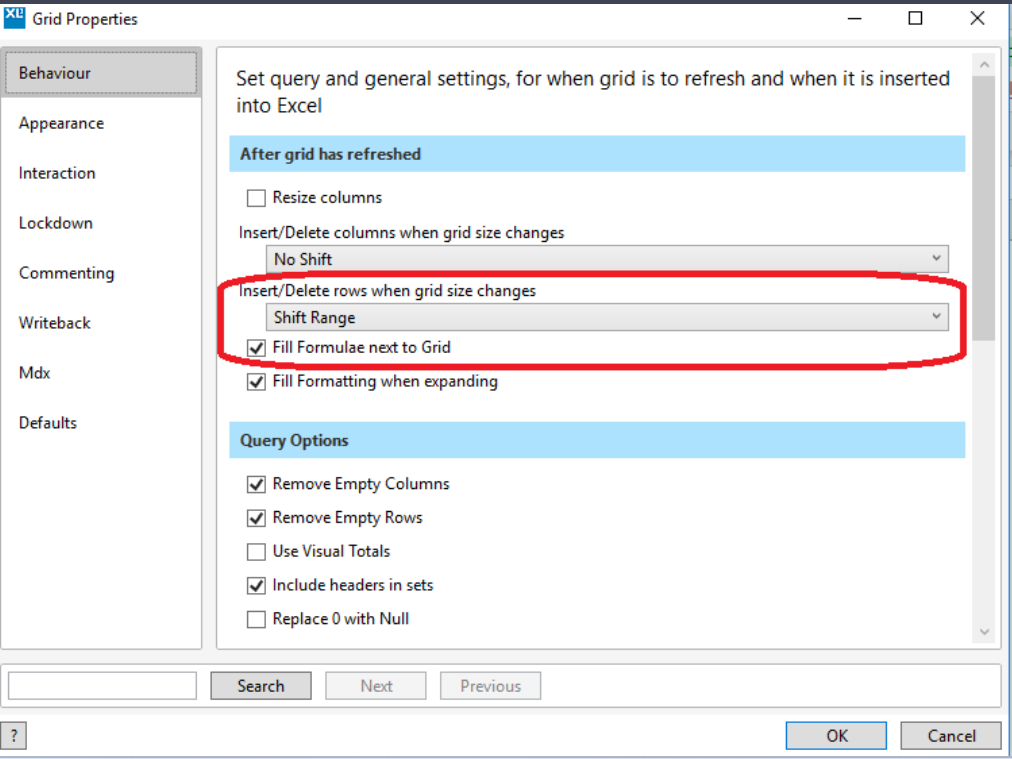
Using 'Fill Formula Next to Grid'
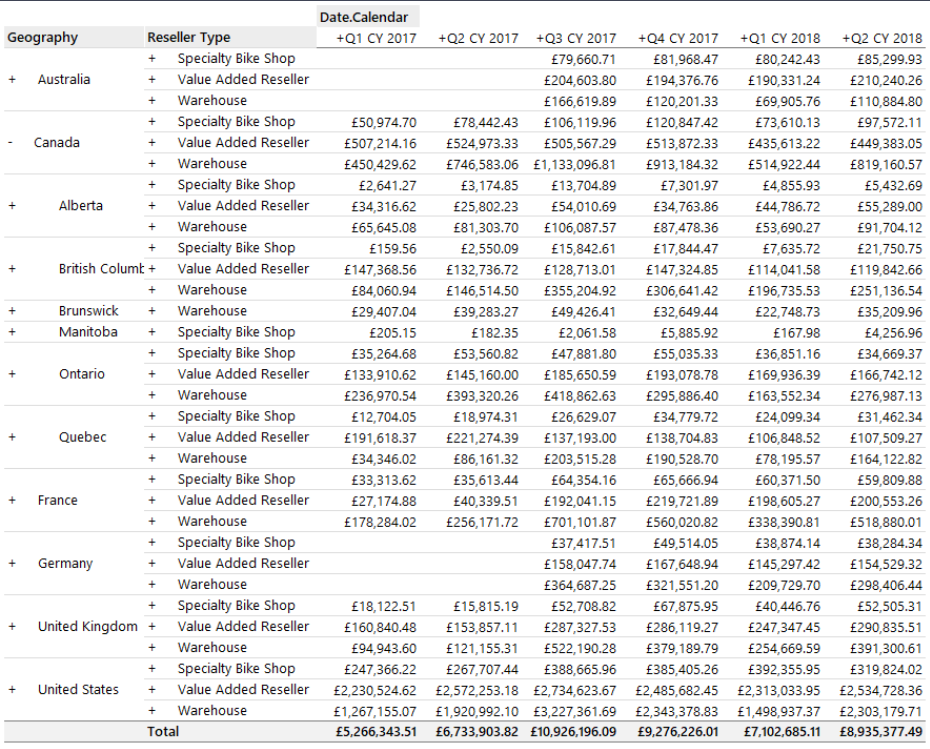
It's possible to create a similar effect without adding an Anaplan XL Grid Calculation. Write the relevant formulas in the cells underneath the grid. In the grid properties, turn on shifting rows and fill formulas next to grid. This'll make sure the formula isn't overwritten if the grid rows are moved (rows are changed). It'll also spread along columns if columns are moved (the formula is filled next to the grid).
This technique has been combined with Anaplan XL Subtotals to create a grid broken down in to subtotals with a grand total in the final row. The grand total is the XL3Lookup formula as used in the previous example.