You can use visual grid charts to show a chart for gross profit and when the margin falls below a specified value.
Start by following the MDX Calculations tutorial to create the initial report.
To create the Gross Profit bar chart:
- Open the Hierarchy Editor for
Measuresby double-clicking on theMeasureshierarchy label. - In the Gross Profit dropdown, select InCell Chart:
- Select Bar as the chart type and choose one with a value axis as the subtype.
- Select Current Member for the Hierarchy members to chart.
To create the Gross Profit Margin alert indicator:
- Select the Gross Profit Margin dropdown, and choose InCell Chart.
- Select 3-State Alert Icons (Red Shade) as the chart type.
- Select the Chart Format button to change the format, and change the first color's condition to > 0.6 and the second color's condition to > 0.55.
- On the Label tab, set the chart label to Alert, then select OK.
- Select Current Member for the Hierarchy members to chart.
- Select OK again to accept the chart.
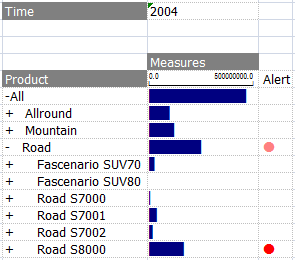
When you run the report, all of the Road product group is in a warning state, and Road S8000 is in the alert state: