Visual grids add visualization capability to the dynamic Anaplan XL grid.
In-cell charts give historical information to headline numbers and let you quickly compare trends and patterns, while still keeping the environment. So in any Anaplan XL grid you can choose to display the numbers, and the historical trend through in-cell charts.
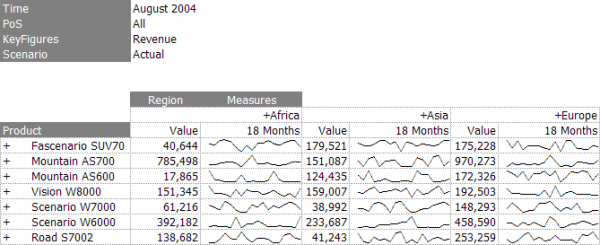
In this case, we can see a revenue fall across all products for Europe in the same time frame, which should be investigated further and understood. There are many formatting options around the charts. For example, you can use a common chart scale across the whole grid. This can be used well with column or area charts.
Add a chart into a grid by selecting measures. In the Hierarchy Editor for Measures, a dropdown menu displays the value (default), or charts the trend:
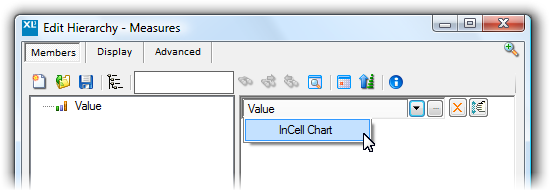
When you've selected InCell Chart, you can configure the chart. The chart types most relevant for time series analysis are the line, area, column, and win-lose types. Further configuration options are available depending on the chart type.
When you have selected the chart type, specify the time context. The dialog defaults to the time hierarchy (or the first time hierarchy if there are several). Choose the required hierarchy, then select the members you wish to chart.

