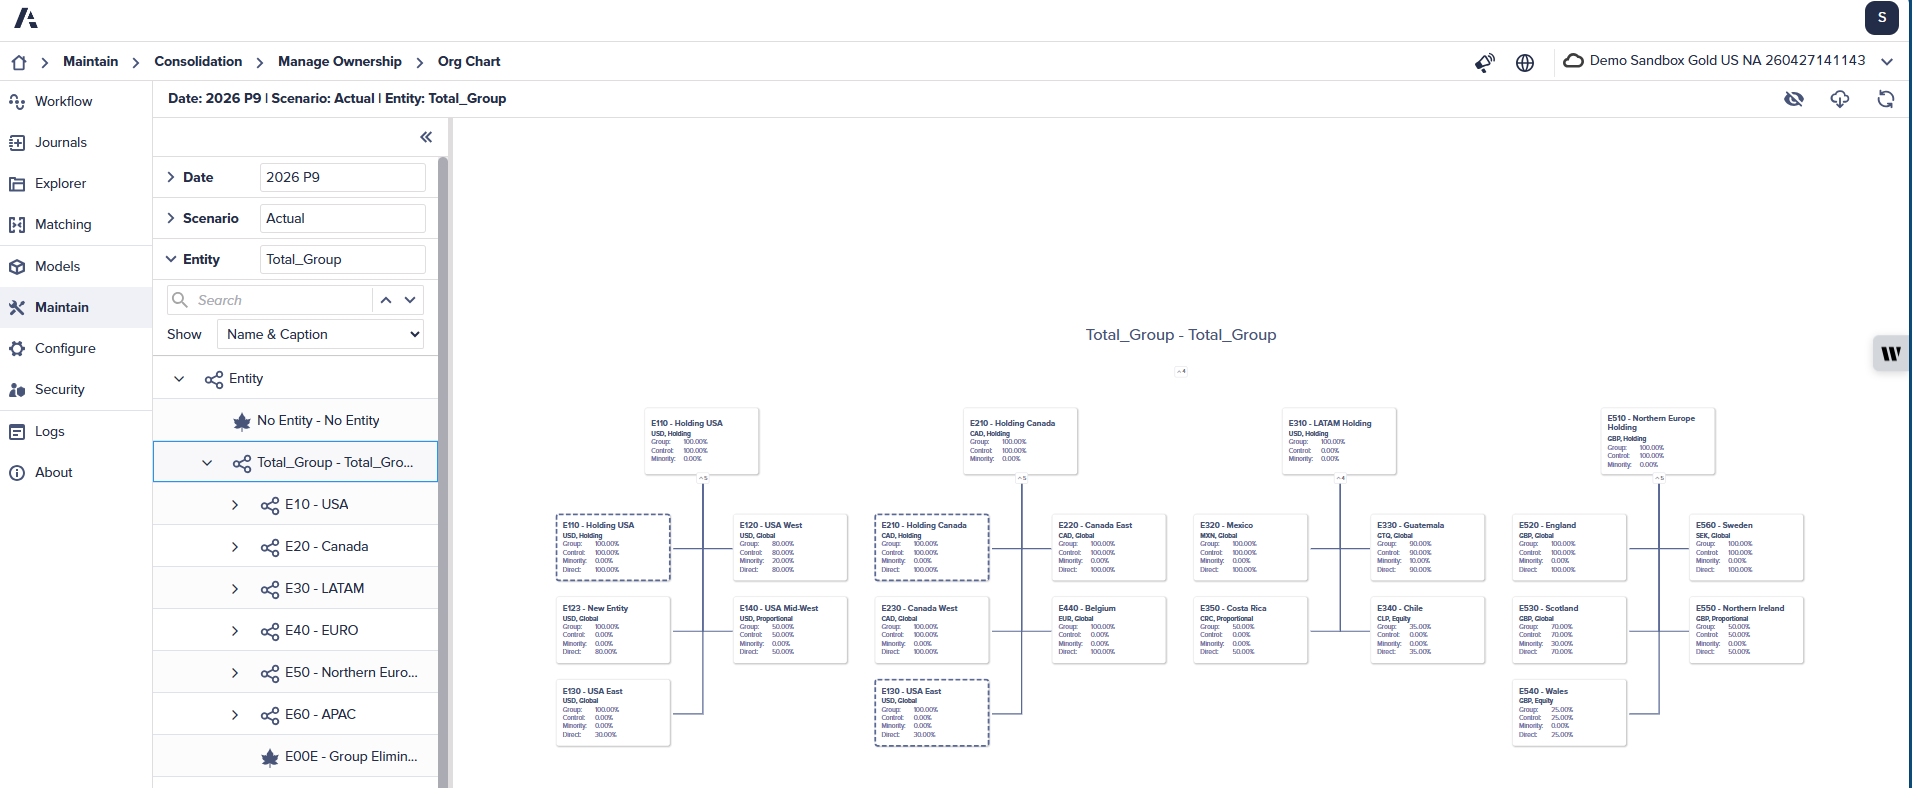
The Ownership Chart visualization provides a clear, hierarchical view of your complex ownership structures and consolidation scopes. It helps you investigate and report on ownership situations by combining data from both your Manage Ownership and Direct Ownership settings into a single, easy-to-understand diagram.
To get started, you need to provide input in both the Manage Ownership section, which defines the cards, and the Direct Ownership section, which defines the connecting lines.
- Navigate to Maintain > Manage Ownership.
- Select the Show Ownership Chart icon to view the visualization.
- On the left panel, filter the chart by selecting a Date, Scenario, and the group of Entities you wish to analyze. You can only display one scope at a time. You can modify your selection at any time.
- Use the checkboxes on the right panel to select optional details to display on each card, such as:
- Currency
- Method
- Group Percentage
- Minority Percentage
- Control Percentage
- Direct Percentage
- Customize the chart's appearance using the presentation options, which include different layouts:
- Top to bottom
- Bottom to top
- Left to right
- Right to left
- Compact view
- Level view
- Expand or collapse all rows
- When your analysis is complete, select Export as PDF to save a copy of the chart.
- Select the Refresh icon if your ownership data has changed.
Example of an Ownership chart: