Use Pivot with selections to change how you view your data.
You can use Pivot on data that already has independent selections applied.
Example: Independent Selection
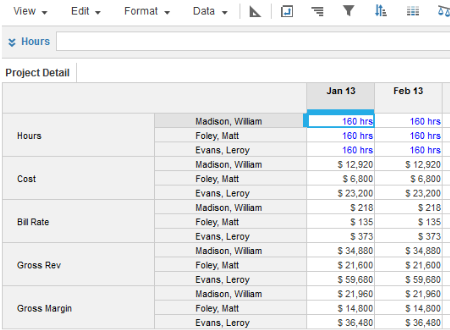
In the example below, Madison William, Foley Matt and Evans Leroy are selected and set to show Every Occurrence. The data displays the columns Madison William, Foley Matt and Evans Leroy in the nested axis of months of the year for 2013.
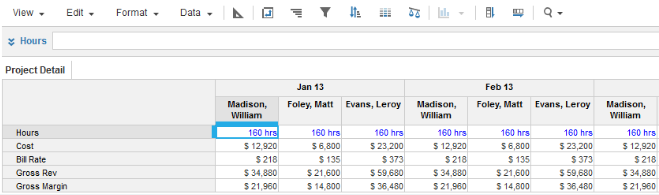
In the example image below, the data with the independent selections has pivoted. Madison William, Foley Matt and Evans Leroy display as rows in the nested axis of project resources.