Related data is an optional data type that can improve the accuracy of your forecast. It consists of one or more numerical or Boolean times series and represents drivers or variables that relate to the forecasted items. Examples are: sales price per SKU, or active/inactive monthly product promotions.
To create a related data module:
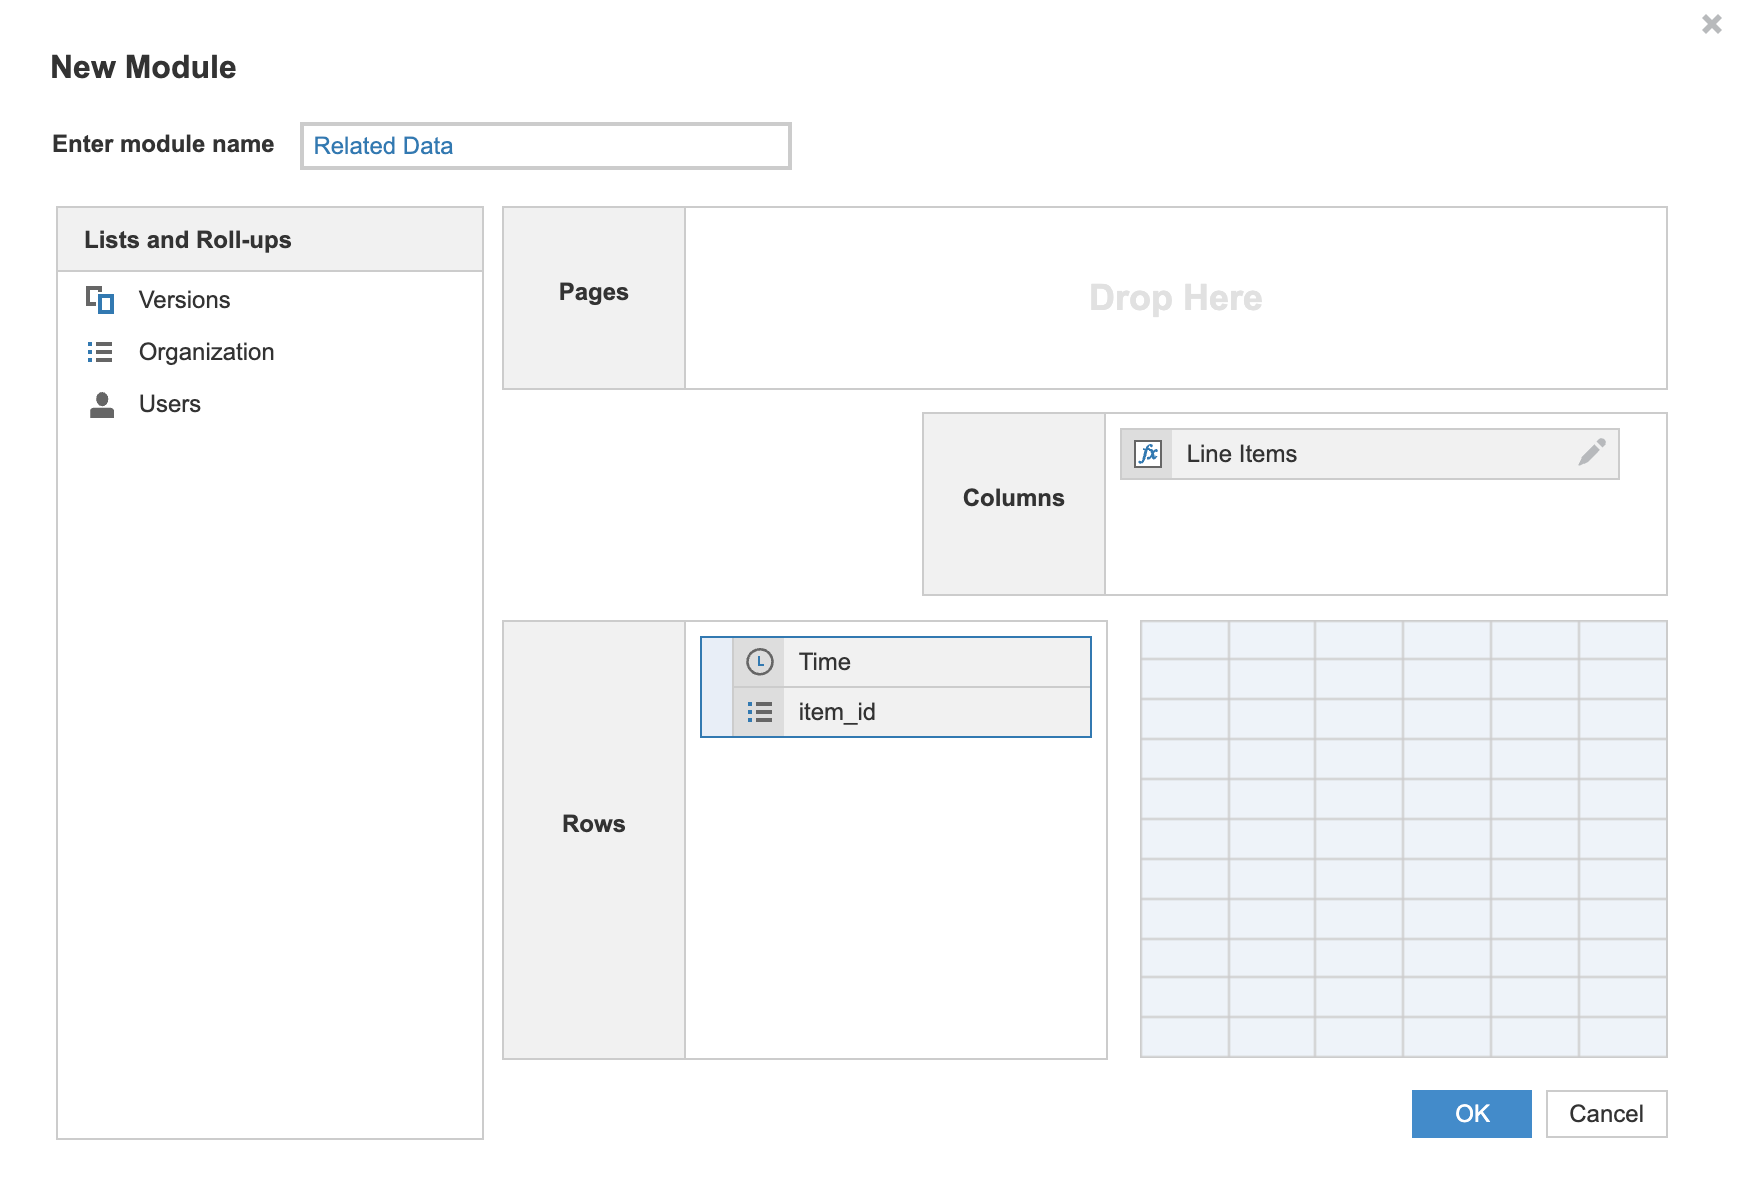
1. Create a module with the three dimensions shown below.
- Time dimension as a row:
- The dimension should represent monthly, weekly, or daily data.
- The frequency of the data should correspond to that of the historical data.
- Item ID list as a row (the same list used in the historical data module).
- New line items as columns:
- Each line item represents a related data time series.
- In Blueprint mode, format the line items as a number or a Boolean.
- You can create up to 28 line items.
- You can't use line items that are configured as summary items.
We recommend using 30 or fewer characters in line item names (column headers) to avoid truncated feature names for explainability results.
2. Import the related data into the module and verify that the fields map correctly.
Your related data must include both historical and forward-looking values. Forward-looking values must cover the entire length of the forecast horizon.
You can use the exclude values functionality to replace undesired values in your related data. See Exclude values for details.

