The Anaplan XL Reporting task pane is a sidebar designer that you can use instead of the Report Designer.
You can use the task pane on grids, Tabular Analysis Services reports, and dynamic charts, but not on SQL tables. You can access the task pane on the Anaplan XL tab.
In the example below, there's a table report at A1 and a grid report at E1.
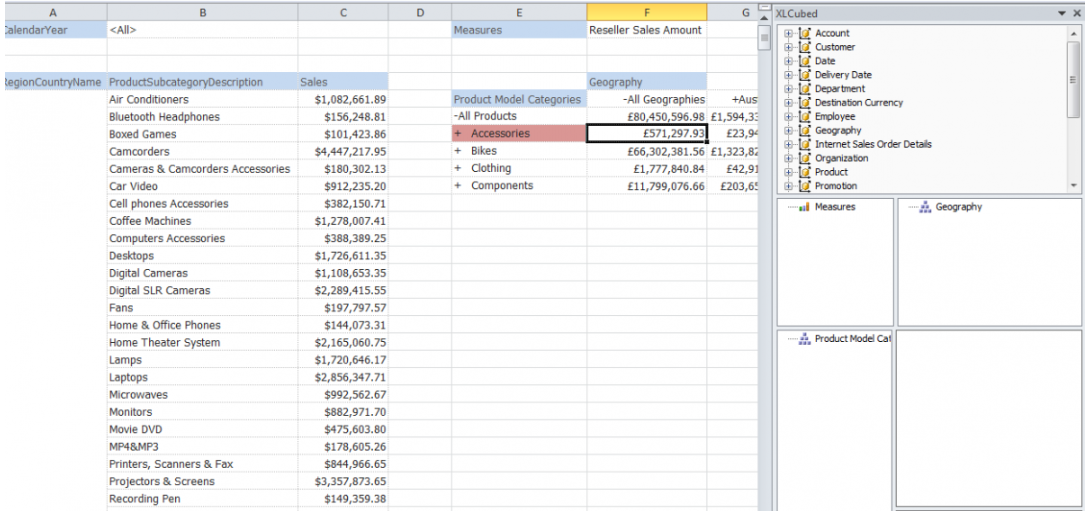
The task pane is on the right. The focus is currently on the grid report so the task pane shows information about the grid: Measures on header, ProductModelCategories on rows, and Geography on columns. You can quickly drag and drop as needed. Selection on the table report makes the task pane refresh to show the table report detail instead.
Inside the task pane, the behavior is the same as in the Report Designer. For example, select a column inside the task pane, such as RegionCountryName, and it displays all its members. You can also search for members and set up criteria for which members to be retrieved.

