Grids are designed for analysis. You can also use them for formal reporting, depending on the formatting required.
For more flexible layout options, use formula reports.
Grid reports (reports generated using the Design Grid option) are treated as a single object by Anaplan XL Reporting. The report shape is always rectangular, similar to Excel's PivotTables. However, much of the power of grid-based reporting is in the additional functionality not available through native PivotTables.
You can modify or design grid reports using the Report designer, or by dragging the hierarchy labels to the axis where you require them.
Double-click members (known as drilling) to get more detail on them. You can also access functions such as subtotals and grid calculations, by right-clicking members.
You can have multiple grids in a worksheet. There are shown in the Anaplan XL ribbon or toolbar.
Use Anaplan XL to format, modify, or delete grids, rather than native Excel, otherwise changes aren't kept when the grid is refreshed.
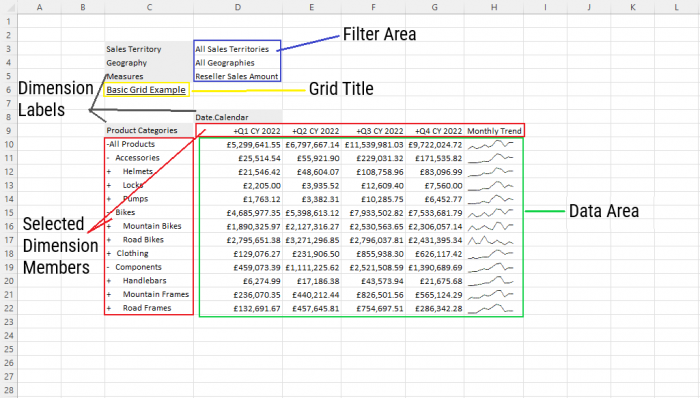
Grid components
These are the main components of a grid:
- Header/filter Area (C3:D5)
- Dimension labels (C3:C5, D8, C9)
- Selected dimension members (B10:C20, D9:H9)
- Data area (D10:G20)
Edit grid
Return to the Report Designer for the current grid by right-clicking the grid, and selecting Anaplan XL > Design Grid.
Grid task pane
You can toggle the grid task pane on and off by selecting Task Pane in the Anaplan XL ribbon.
The task pane enables grid selections and the re-positioning, adding, and removing of hierarchies within the grid. Changes are optionally applied instantly or by selecting Apply.
The task pane displays the content of the currently active grid, and updates as each grid is selected.
Saved grid reports
When you reopen saved grid reports in Excel, to connect to the data source, select Refresh Grid on open in the Grid properties form. This ensures load time is kept to a minimum, and only those grids required for the current session are activated.
To activate a grid, double-click the grid.
Note: You can convert a grid report to a formula report.
Also see Anaplan XL Reporting guardrails.

