Multisheet templates are a flexible way to create reports spanning multiple sheets, where the structure of each created sheet is potentially variable. The final multisheet report is generated from a single template designed in Excel. The template designer defines ranges for the sets of column and row members available, and then defines how to combine them for each output sheet.
Multisheet templates are based on the capabilities of Freeform reports in Anaplan XL, and provide a flexible way to define these in the context of a multisheet report.
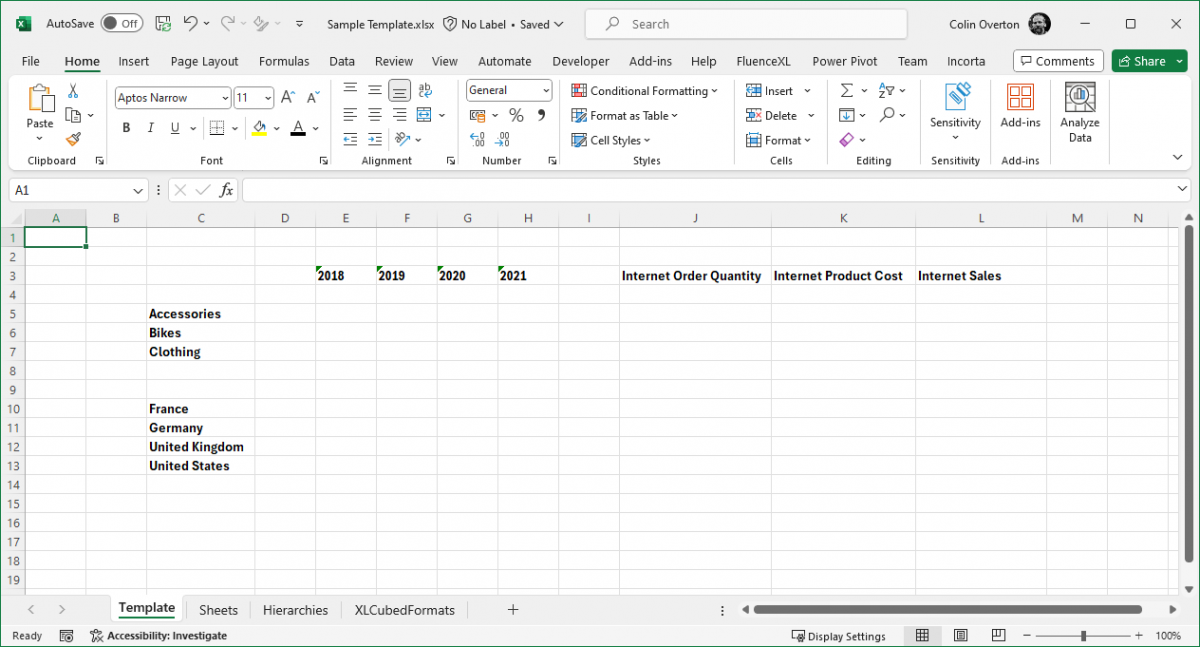
As an example, you can define two sets of columns and two sets of rows, and use this to create four output sheets.
This input
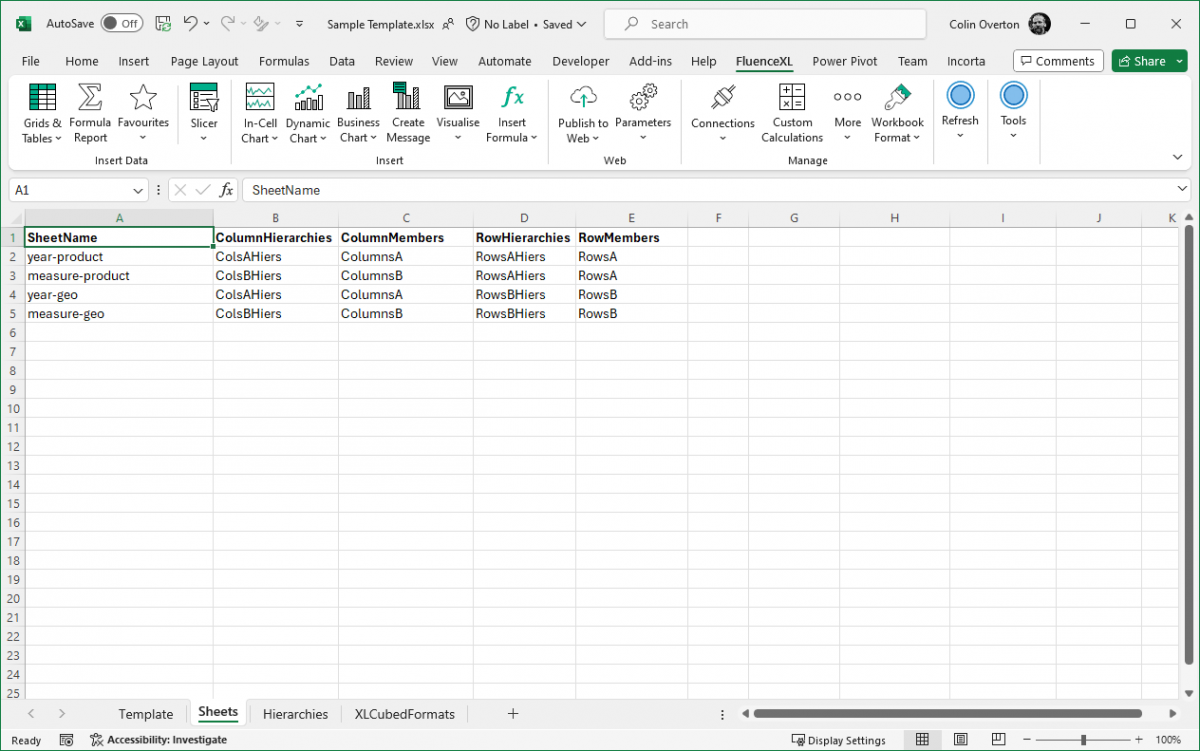
uses this configuration template
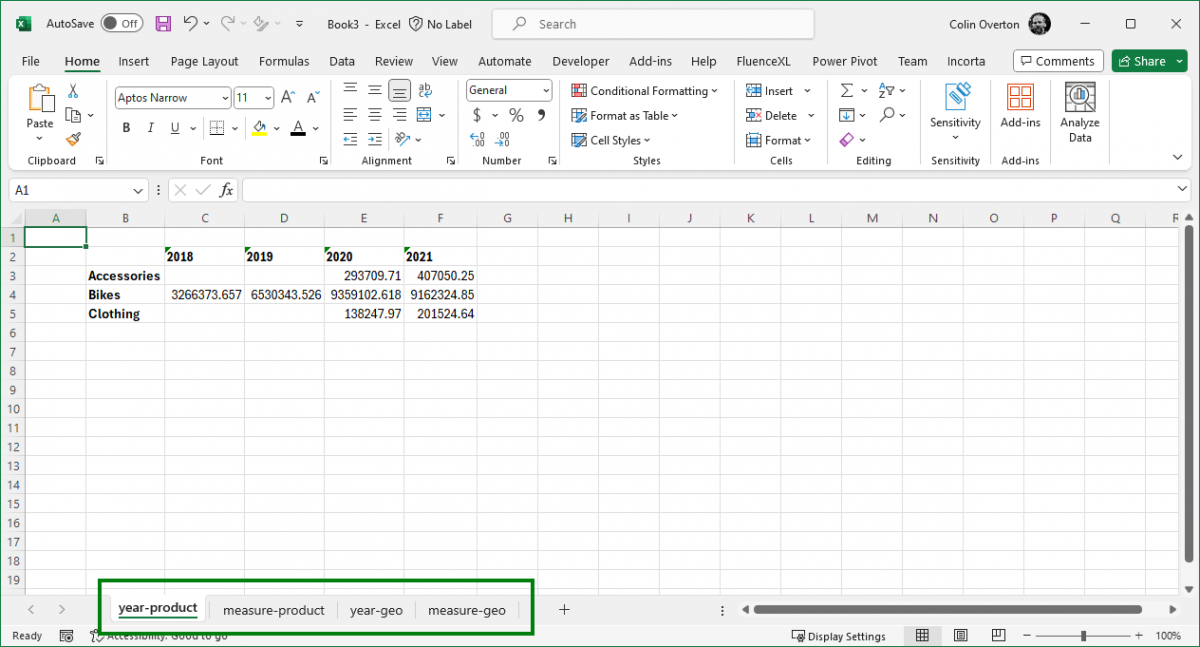
to create this multisheet output
How it works
This feature enables schedules to create multiple worksheets in an output workbook.
Based on the output sheet configuration, Anaplan XL will:
- Create the required sheets.
- Copy in the members defined for that sheet. Any formatting on the members will be carried across into the output sheet.
- At the intersection of the column and row members, data will be retrieved from the model and added to the worksheet. Any formatting of the data will be preserved so you can add number formats, bold total rows, or highlighted backgrounds.
The data retrieval aspect works the same way as Freeform reports and shares many of the same settings.
Basic configuration
The template book must contain at least one connection to a model which will be used for data retrieval. You can have multiple connections and use a different one for each sheet, discussed later.
You must check the Workbook is a multisheet template option in the Workbook Options > Web Publication screen to identify the workbook for proper handling when published to Anaplan XL Web.
The output sheet configuration must be in an Excel named range called SheetsConfig, and at a minimum it must contain the columns below:
SheetName | Name of the output sheet to create. |
ColumnMembers | Name of range containing the column members. |
RowMembers | Name of range containing the row members. |
Note the ColumnMembers and RowMembers ranges must be on the same worksheet. The other names can be on separate sheets if it makes the template maintenance simpler.
You must also have named ranges for ColumnHierarchies and RowHierarchies so that the members can be linked to the hierarchies they belong to. If you have the same hierarchies for many column or row sets, you can create workbook names for those.
In the above example, you have different hierarchies being used in each column/row member set, so have overridden those settings on each row. In general, you can have an Excel name in the workbook for a given setting, and can override these for each configuration row as required.
Here you can see the names created in Excel for the sheets config area, as well as for each of the column and row areas.
Filters
To add filters to a sheet:
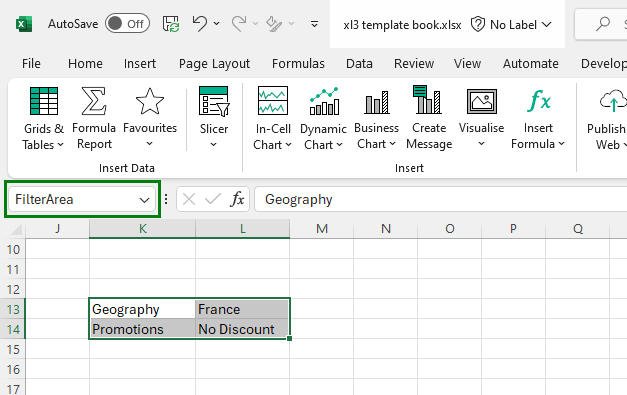
- Specify the name of the Excel range that contains the filters you want to use for the sheet.
- Add a named range called FilterArea to provide default filters for all sheets produced.
This range must have exactly two columns, and each row must contain the name of the hierarchy followed by the member to filter on.
Additional Configuration Columns
You can have extra columns in your configuration table to control the output of each sheet created. These are all optional.
TabColor | Color of the worksheet tab in Excel. |
ConnectionID | ID of the connection to use (if not the first conection in the workbook). |
StartColumn/StartRow | Position to begin output in the worksheet produced. Defaults to 2,2 cell $B$2. |
NullReplacement | What to put in null cells, default is to leave them blank. |
MemberMode | How to interpret the member text. Values can be Validate/Caption/Key/UniqueName. |
InvalidMemberReplacement | What to put in cells when a member is invalid. |
BlankHandling | How to handle a blank in a member cell. Values can be CopyPrevious/DefaultMember/Error. Default is CopyPrevious. |
ReplaceFormulaeWithValues | Should calculations in the data area be replaced with fixed values. |
You can also override any default by adding columns of the same name in the config table. For example, you could add a column called FilterArea to provide a different Excel named range, and override the default FilterArea named range in the workbook.
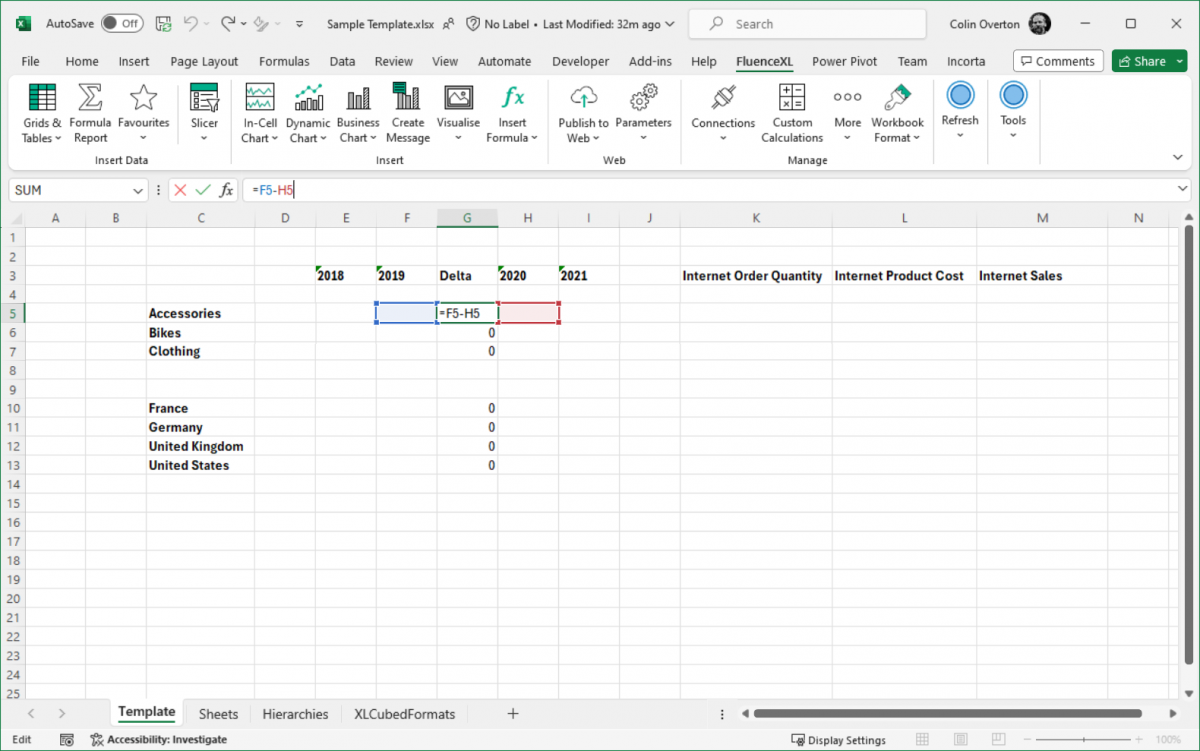
Calculations
You can add calculations to the columns and rows areas by typing a formula into the data area where the columns and rows meet. They'll then be propagated to the output worksheet.
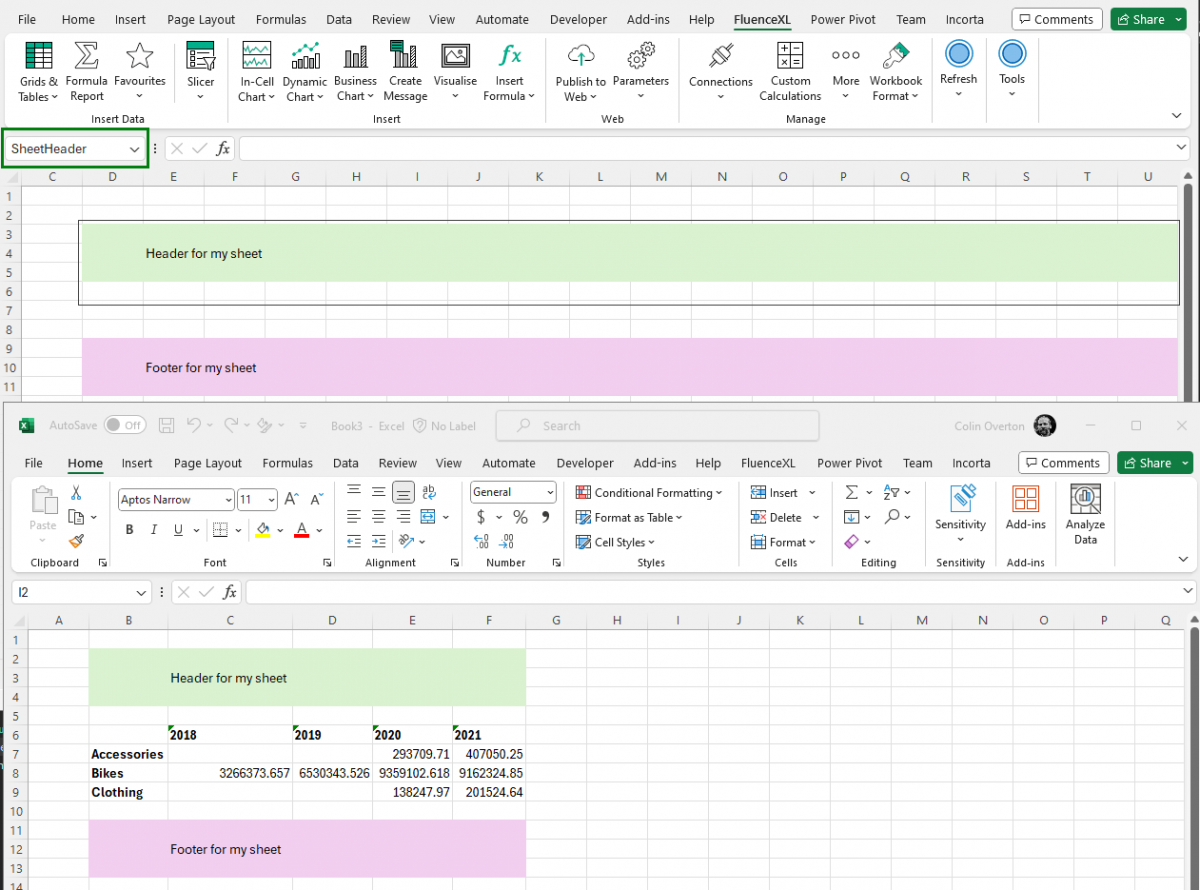
Headers and Footers
You can add a header or footer to each output worksheet by creating a named range called SheetHeader or SheetFooter. This name can be overridden in the config table by adding a column called SheetHeader/SheetFooter and putting a different name in the cell for the output sheet.
The Header/Footer area will be copied to be the same width as the data in the sheet created. You should add formatting extending to the right so it looks good when copied.
Alternate column/row titles
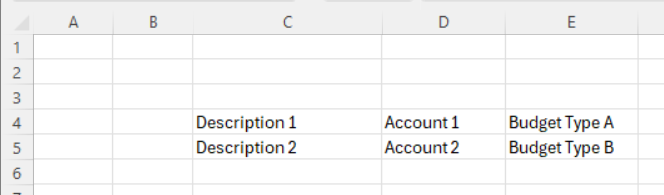
Sometimes you need a combination of members across multiple dimensions to get the number you want, but you don't want to display all the members in the final report.
You can add meaningful descriptions to the left/top of the real members to do this, and then hide the members from the user.
You must include the descriptions in the members' area you configure so that the text is copied into the target sheet. Only the last columns or rows are used as members in the database query. The number of real members is specified by the number of hierarchies in the Column/RowHierarchies named range.
For example, if I have specified two hierarchies, Account and Budget Type on Rows, I can add a text description that is more useful in the end report.
Column and Row Configuration
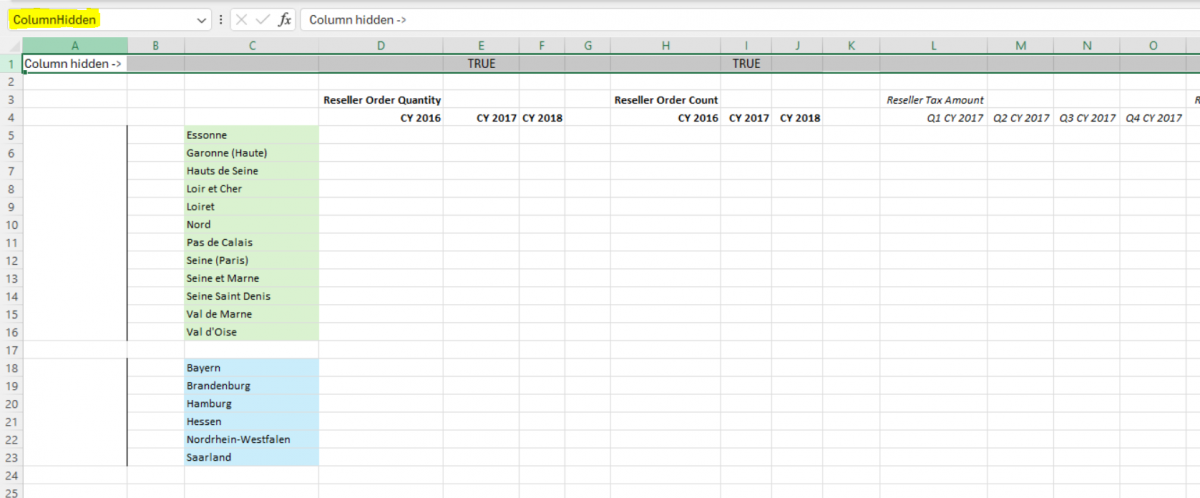
Some settings are configurable for each column or row. In this case, you create a named range for the entire column or row with the specified name, and the settings are read for each cell as the template is generated.
For example, to hide some columns, you create a named range called ColumnHidden and set some of the values to True.
In this case, the columns $E:$E and $I:$I will be hidden in the result file.
Available settings are:
ColumnHidden/RowHidden | Hide the specified columns/rows. Default is false. |
ColumnNumberScaling/RowNumberScaling | Scales the numeric results, can be used where you want to have numbers in thousands/million/billions. This changes the actual number in the cell. If you don't want this, use number formatting instead, to only change the display. Possible values are single letter K, M, B, and T for thousands, millions, billions, and trillions. Alternatively, you can put a number in and that will multiply the result. For example -1 would swap the sign of all results. |
Output Variables
You can create Excel names with special values that'll be populated during report generation. This can be useful to change some settings based on the sheet name.
SheetName | Name of the sheet being created. |
RunDate | Date/time of generation. |
Also see Anaplan XL Reporting guardrails.

