Anaplan XL Reporting helps business you create reports and dashboards.
You can also carry out your own analysis and data exploration without the need for any programming experience.
You can use Anaplan XL for planning and budgeting models. The two core products are based on Excel and Web.
Data sources
A key aspect of Anaplan XL Reporting is that the data itself isn't held in Excel. Anaplan XL Reporting connects to a range of data sources, including Microsoft SQL Server Analysis Services (SSAS) Tabular and Multidimensional, Power BI, SAP HANA, IBM TM1, Kyvos, Incorta, Atoti, Anaplan, and Anaplan Financial Consolidation and Reporting. Anaplan XL Reporting can also connect directly to relational databases, with a subset of the overall Anaplan XL Reporting functionality.
How is it used?
Anaplan XL offers a managed self-service business intelligence model. IT creates and owns the cubes or tabular models, and business you can create and keep your own reports, dashboards, and analysis. This gives you the flexibility and control for reporting, but IT retains control of corporate data.
Anaplan XL Reporting consists of two core products:
- Excel Edition – an add-in for Microsoft Excel (Office 365 desktop, Office 2021, 2019, 2016, and 2013 desktop). It provides a powerful and flexible reporting, analysis, and dashboard environment. Anaplan XL extends the presentation and query capabilities of Excel. It offers additional data visualization components. You can do much more, and much more quickly, than in a standard pivot table environment, while still using your Excel skills.
- Web Edition – Web server-based software that provides intranet or internet access to interactive reports via all standard browsers and mobile access. Reports created in Anaplan XL Reporting — Excel Edition can be published to Anaplan XL Reporting Web for broader distribution. Anaplan XL Reporting Web also enables you to perform ad hoc reporting.
Anaplan XL terminology
A cube is a data structure organized into measures and dimensions.
It contains these objects:
- Measures
- Dimensions
- Levels
- Members
Measures
Cubes can be structured differently, but measures are typically the elements you want to sum in reporting. Typical measures might include Sales Volume, Unit Sales, and Unit Cost.
Dimensions, hierarchies, and levels
Dimensions are the bywords of reporting. For example, you may want to report sales by Region, by Period, or by Product. Region, Period, and Product would be different dimensions in the cube. Anaplan XL Reporting makes it easy to add dimensions to a report and choose which elements to analyze.
Dimensions may consist of one or more hierarchies. Hierarchies are ordered groupings or drill paths of the data. For example, a Time Dimension may consist of both a Fiscal Date and a Calendar Date hierarchy. These are different ways to group days into months, quarters, and years.
A Geography hierarchy could have three levels: Country, State, and City. You can select items at any level, or start at a higher level and drill down for details.
Members
A member is any element, at any level within a hierarchy.
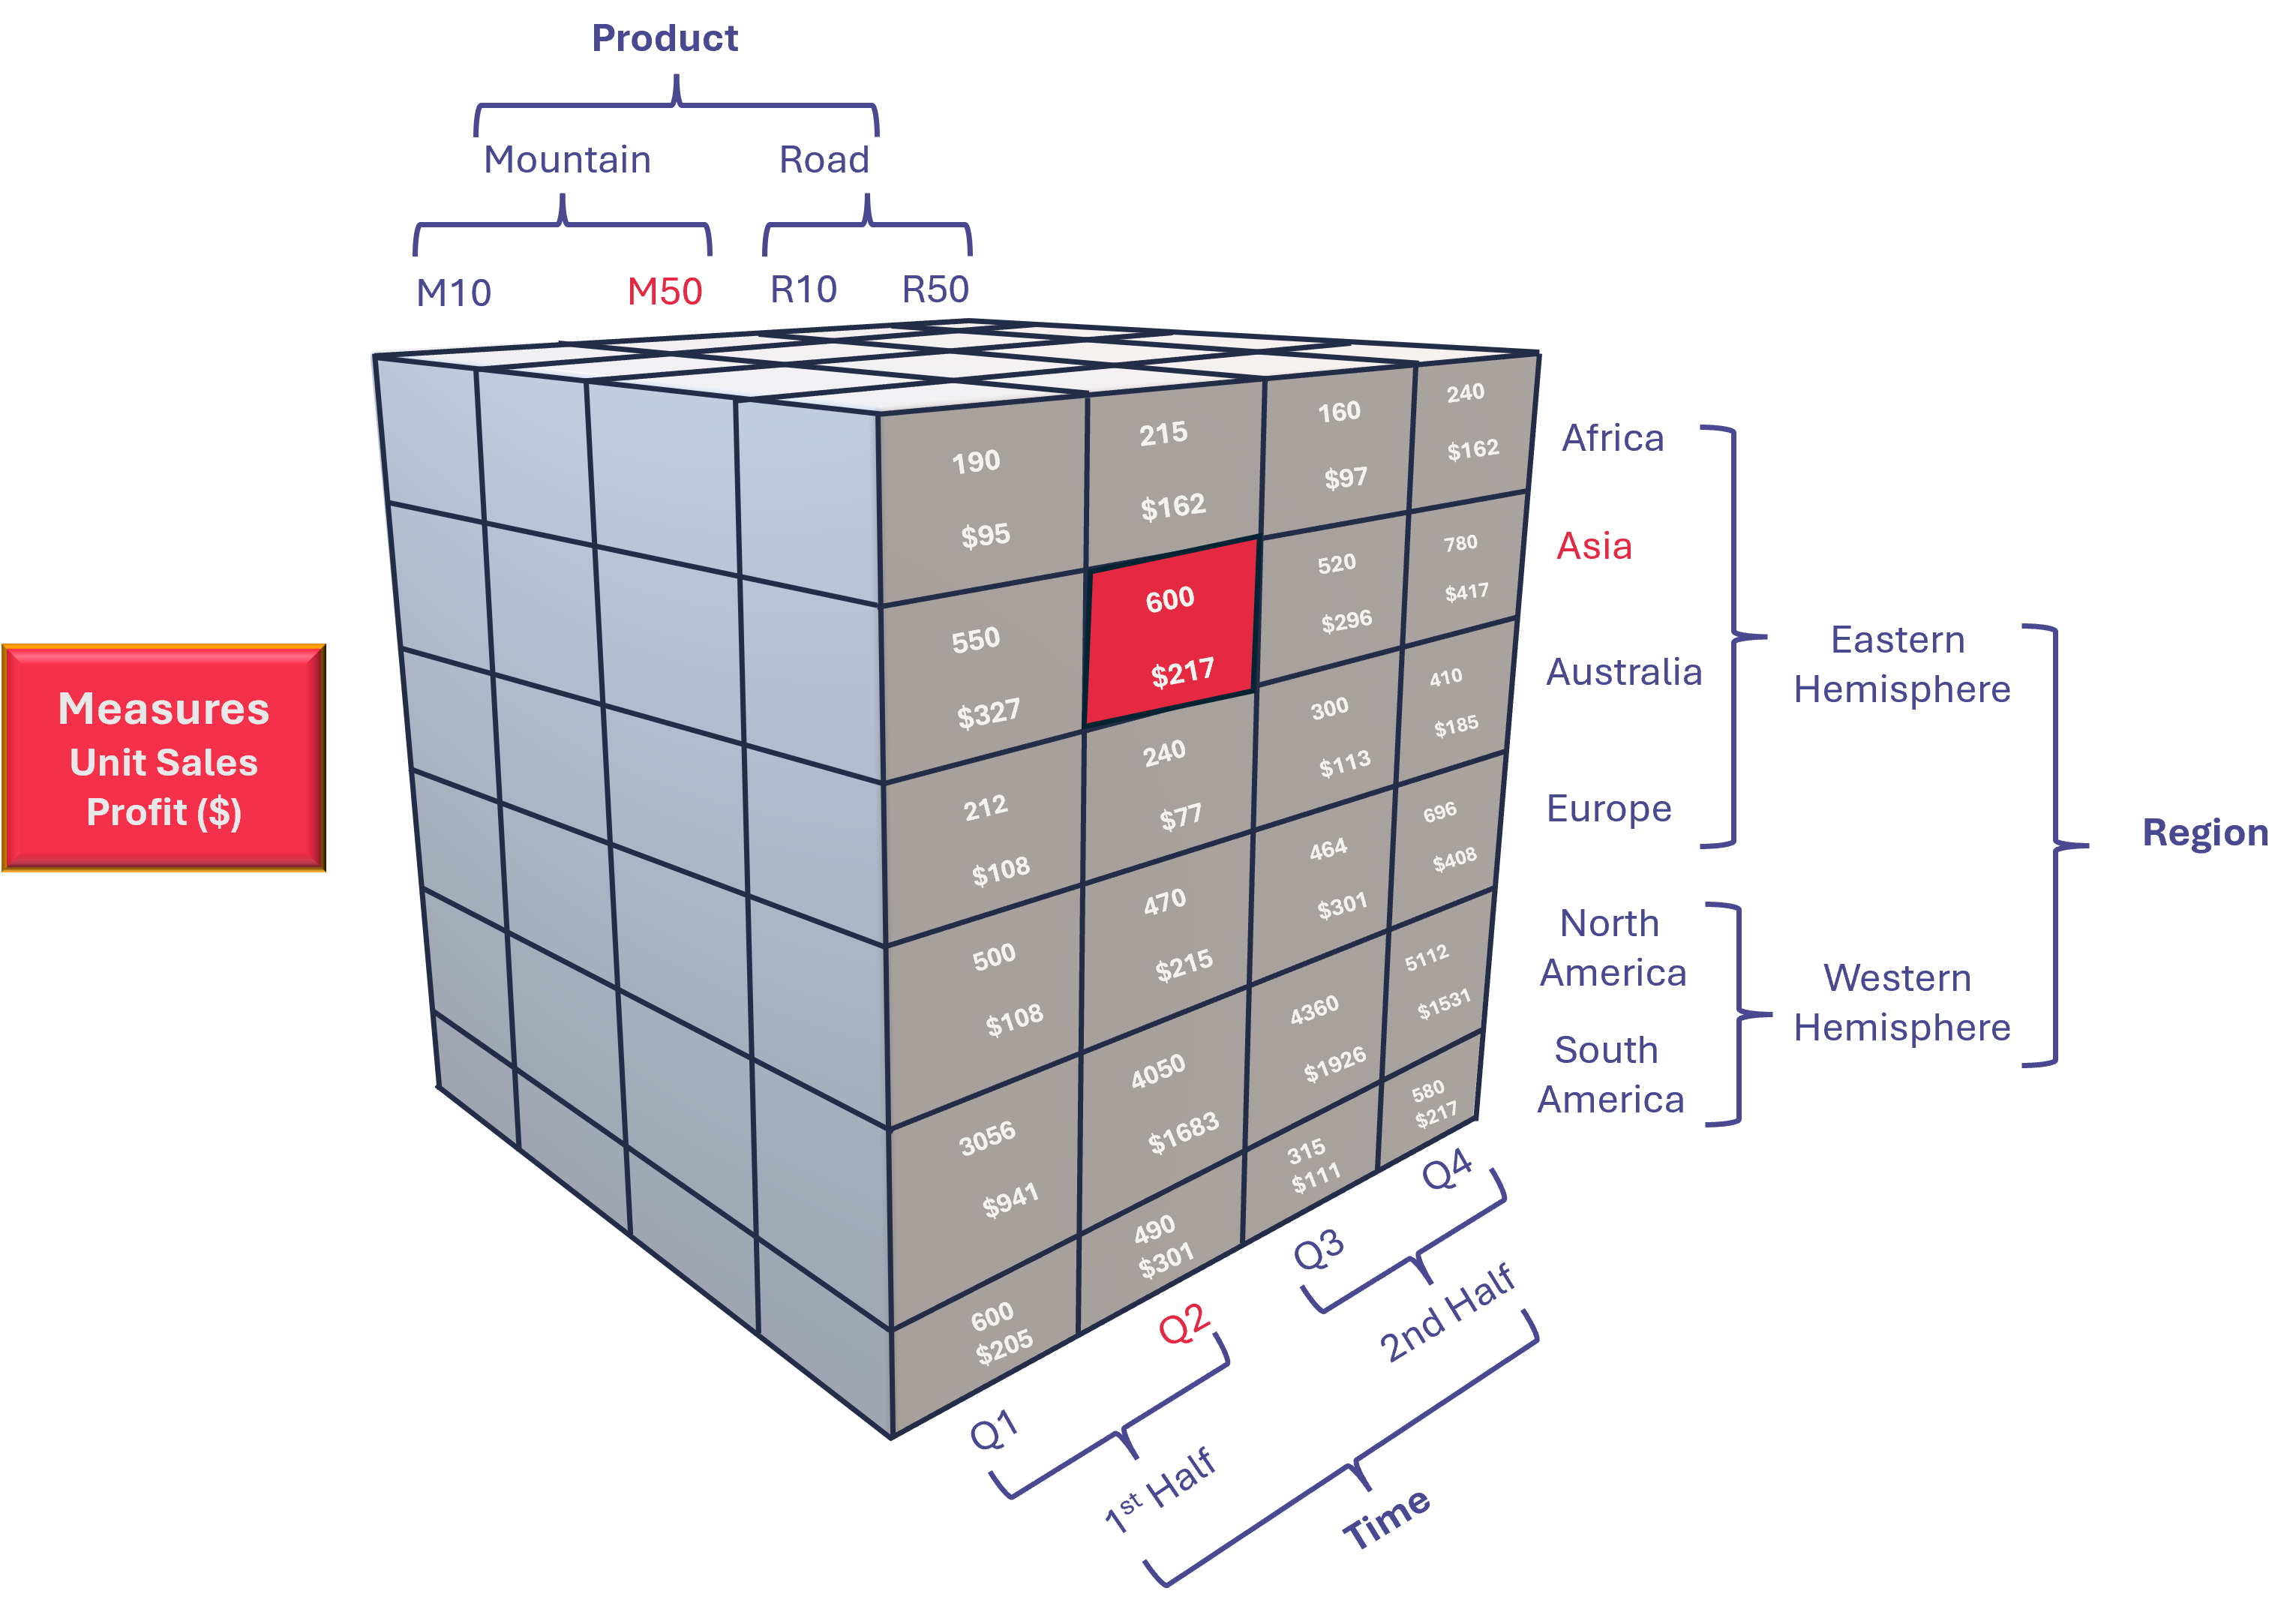
Real-world cubes typically have more than three dimensions. The diagram shows a simple sales cube for a bicycle sales business. The cube contains two measures, Unit Sales and Profit, and three dimensions:
- Product: The product being sold. All products sold are bicycles, and they're categorized as either Road or Mountain bikes, with two model types in each category.
- Region: The region the product is sold in, categorized by Hemisphere.
- Time: The (simplified) time period during which the product was sold. In this case, it goes only to the quarter level but would typically begin at the year level and go down to the month or day level.
Each axis of the cube represents one dimension. The texts along the cube's axes are the dimensions' members. Example members are M50, Asia, and the Q2. The individual members aggregate into the hierarchy structures of the dimension.
The values within the cube represent the measures, Unit Sales and Profit, in this case. Each cell in the cube contains a value for each measure and is formed by the intersection of the dimension members. For example, the cell shown in red represents the intersection of (Product: M50, Region: Asia, Time: Q2). The measure values are Unit Sales: 600, Profit: $217.
With Anaplan XL, you can determine the values of each measure at every intersection of the dimensions by slicing and dicing.

