Create a basic Anaplan XL Reporting report.
First, download and install Anaplan XL Excel Edition, and then open a new Excel workbook.
All Anaplan XL functionality is available through the Anaplan XL ribbon.
Connect to a data source
To connect to a data source:
- Select the Connections ribbon menu item. In a new workbook, this is empty. Create a new connection by selecting the Add button and then select the New Connection tab. See Connect to your data in Anaplan XL reporting for more information.
- Select the relevant connection from the list of data sources and fill in the details to connect to your data source.
- Select OK, the Manage Connections dialog now has a new entry for the connection that was created.
Create a grid
To bring the data into the workbook, create a new Anaplan XL grid by selecting the Grid ribbon menu item.
This displays the Report Designer dialog box. On the left, all the available hierarchies in the data source are displayed. Drag and drop them on to the relevant areas.
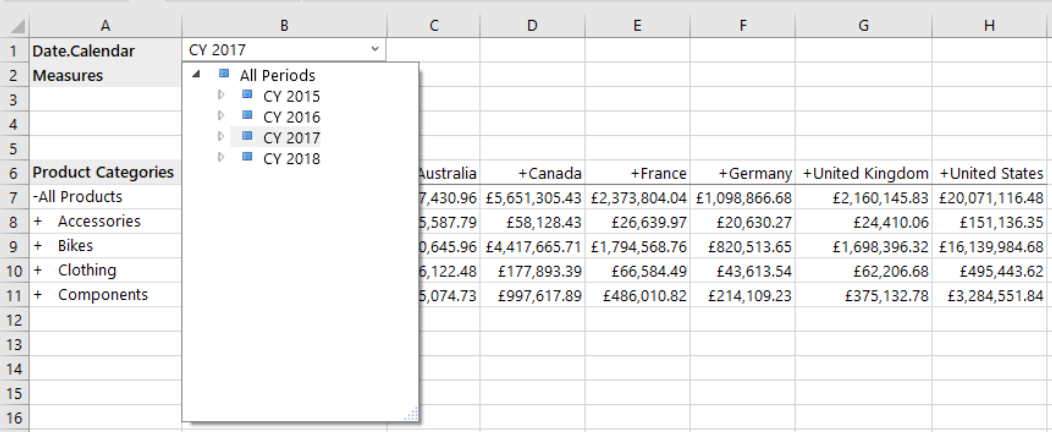
Find the date hierarchy and drag it to the filters section. This populates the right side where member selection can be made.
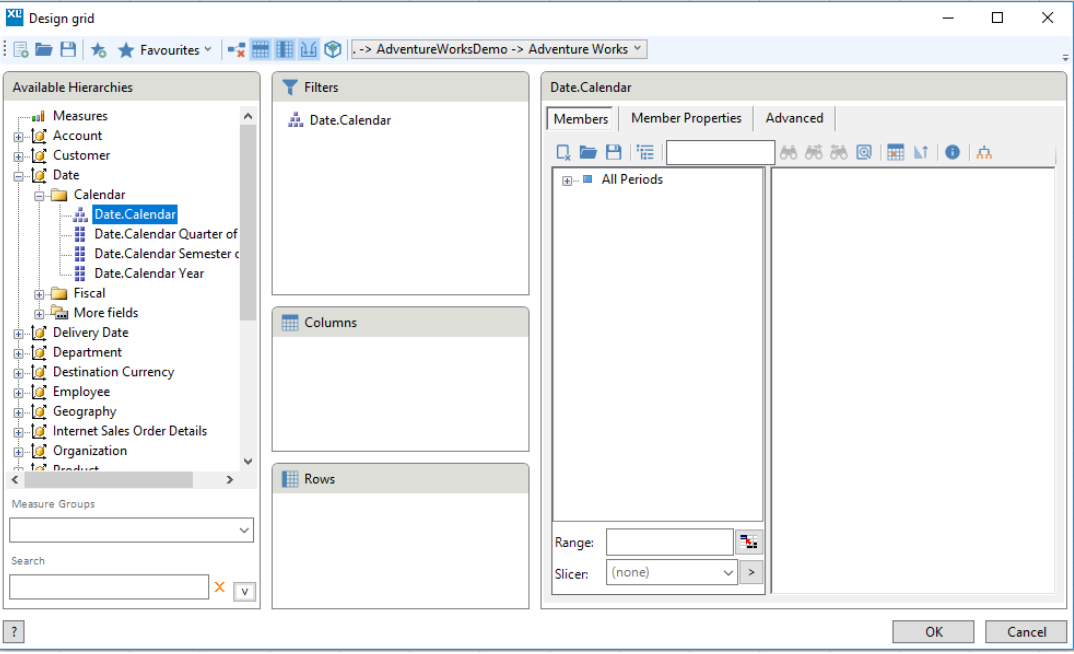
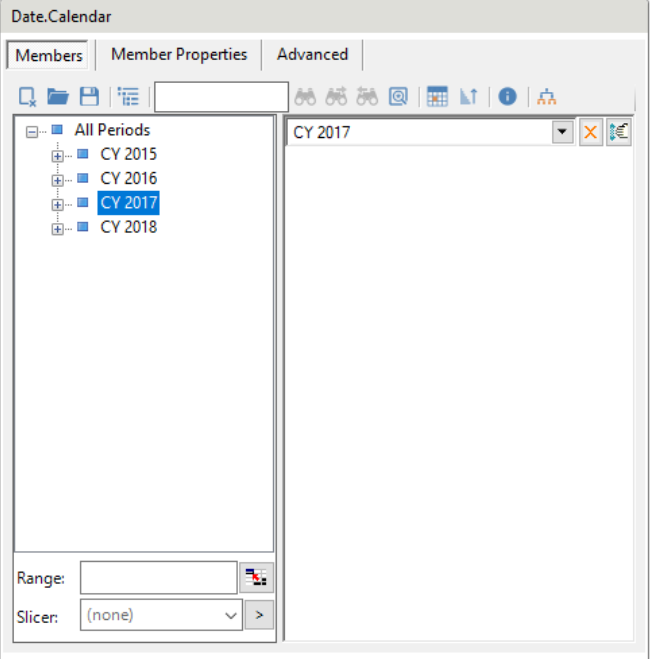
To make the grid show only data from a specific year, go to the All Periods member. Find the year and drag it over to the right, or double-click on it to select it.
Define the measure the grid will be showing data for by dragging Measures on to Filters.
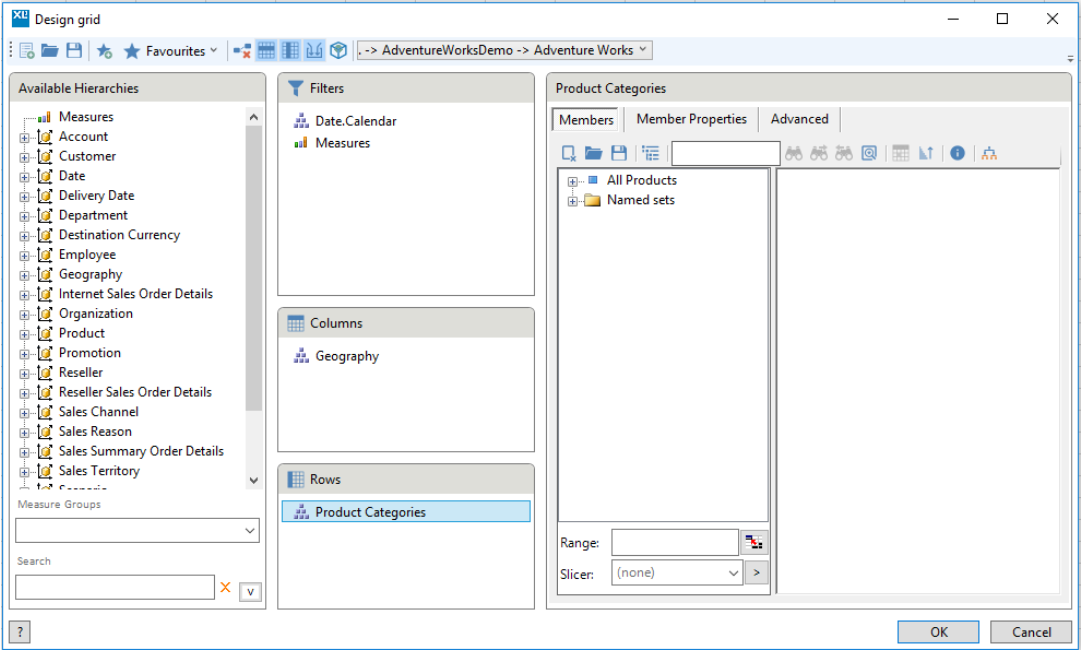
Continue to make selections to refine the report. In this example, these selections have been made:
- Filters:
- Measures – Reseller Sales Amount.
- Date – CY 2017.
- Columns
- Geography – no member is selected, so the default will be displayed (as defined in the cube).
- Rows
- Product – no member selected, so the default will be displayed (as defined in the cube).
Grid navigation and drilling
The new grid has now been inserted into the workbook. It shows the data for Reseller Sales Amount in CY 2017 across Geographies and Products.
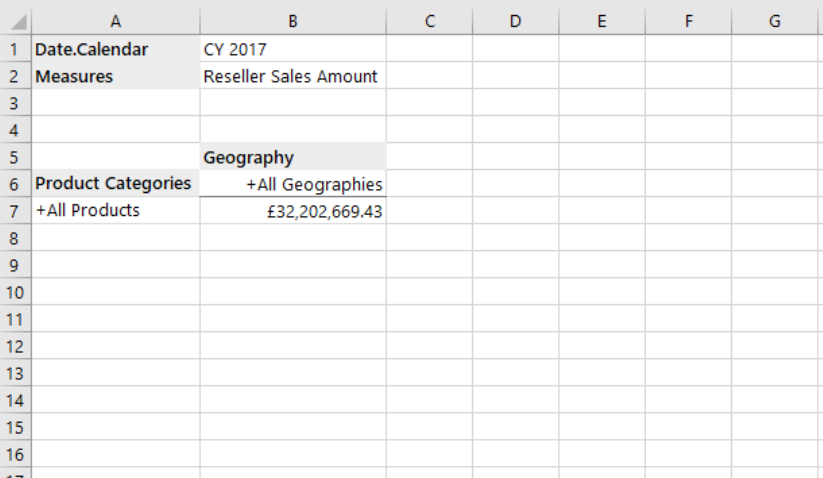
Because no members were selected for the Geography and Product hierarchies, the grid displays the default All member for both. You can drill into the Geography and Product hierarchies to display their child members. Double-click on the parent member and its children's members are then displayed.
You can change the grid by moving and dropping hierarchy labels. For example, you can quickly swap the Geography and Product axes.
Edit a grid
You can edit the grid design in the report designer. Select a cell in the grid and either right-click and select Anaplan XL > Design Grid, or select the Design menu item from the Grid ribbon menu.
Add a slicer
You can add a slicer to a grid to enable quick changes to member selections. Select one of the filter cells and right-click Anaplan XL > Add Slicer. A warning will appear that there are existing member selections. Select OK to create the slicer.
You can move, edit, and resize the slicer using the right-click menu.
If needed, you can connect other grids in the workbook to this slicer. Go into the report designer and in the member selector area, use the slicer option as the member selection.
Add charts
You can insert charts using normal Excel functionality. However, Anaplan XL also comes with several extending chart and visualization functions.
To insert a graph based on the data in the grid:
- Right-click the grid area and select Anaplan XL > Grid Charts. Select Highest, Lowest, or All members, depending on how you want the chart to behave when the grid is drilled into.
- Select which chart type you want to use and then the chart is automatically inserted into the workbook. It's connected to the grid, so after any drilling or drag-and-drop, the chart updates.
- Format the chart in the same way as you would an Excel chart.
Publish your report
To publish your report:
- Select the Publish to Web ribbon menu item.
- Connect to your web server, select a folder to publish to, and give a name for the report.
- Select publish. A message appears when this has been completed.
- Navigate to the Anaplan XL website in your browser. The repository panel on the left displays all published reports. Select your report to load it. The grids and slicers remain interactive and are data-connected.

