You can format dynamic charts from a task pane.
You can format the basic dynamic charts (Column, Line, Bar, Area, Dot, Scatter, Pie, Marimekko, and Maps) from the dynamic chart task pane. You can select the:
- Colour Palette
- Colour by Category
- Chart background
- Chart border
- Chart area background
- Background grid colour
- Axis colour
- Gridline colour
For the new Message Chart types, there are additional sets of properties. If the chart has more than one series, then the properties can be set at the series level.
Charts with variance series
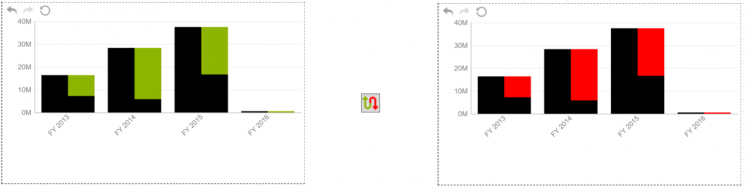
The chart types with a calculated variance series, which are Absolute Variance, Relative Variance (%), Integrated Variance and Indicator Comparison, have preconfigured styles. The styles depend on the selected chart type that can be adjusted using the formatting pane. You can change between the Positive and Negative formatting types by selecting the Switch Style button. All style settings from the Positive Style are moved to the Negative Style. The dynamic chart automatically updates.
Custom properties
Integrated variance chart
The Integrated variance vhart contains a section on custom properties. You can select the custom properties for the:
- Variance lables at variance base check box
- Bar Alignment
- Bar Width (%)
- Bar Arrow Length
This Integrated Variance can be formatted.
The Bar Alignment setting sets the position of the overlying series. In this case, it's the Positive series. The bar width is set to 50% of the overall width. The bar arrow length sets the size of the arrow point. A bar arrow length of 100 represents the whole bar being a triangle.
Waterfall chart
The custom properties associated with the Waterfall chart types are related to the calculated totals. For example, the Auto Total at end checkbox places a Total in the chart. The Auto Delta at end checkbox provides a Delta in the chart.
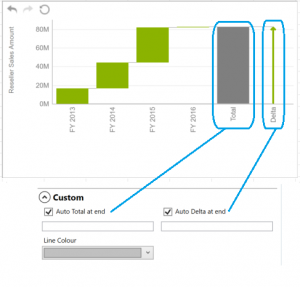
You can define the text for each of the totals using the textbox. If none is provided, then default text is used.

