These are two features that change the layout of a table from that returned by a query, making the result more useful for users. Repeating data can be eliminated, and layout improved, for example for charting.
Sections
Often one or more columns will repeat their value for many lines in the report. Often this isn't useful information, and Sections can reduce this redundancy.
When you enable sections, column values will be written once as a header. As an example, take the report below.
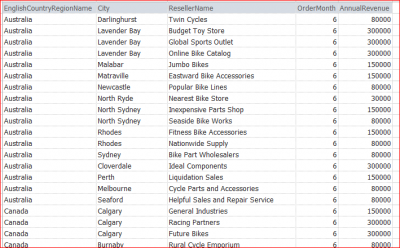
EnglishCountryRegionName is repeated a great deal and doesn't add much value to the report. By going into the Table Properties screen, you can enable sections and use one column in the header.
The result is as follows (EnglishCountryRegionName column has been configured to highlight in bold, using the standard formatting sheet).
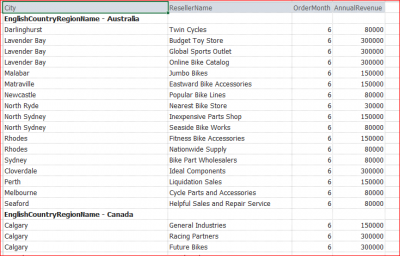
The style of the sections can be controlled using the Table Properties form.
- Sections in one cell
- Sections in separate cells
- Sections in separate rows
- Display column names
- Toggles the column name as part of the section.
Using a combination of sections and the format sheet, it's possible to produce a classic Reporting Services style report:
Hide repeating values
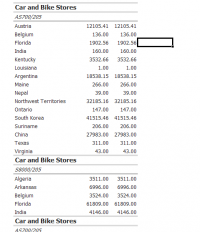
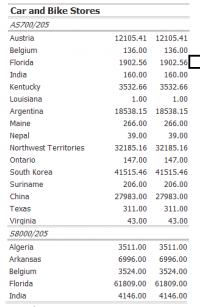
You can hide repeating values - so only the columns with a changed value will be displayed in each section.
With this option enabled, Car and Bike Stores would be shown once and each sub-category listed underneath:
Pivot a column
Pivoting a column takes the values for that column and creates a new column for each.
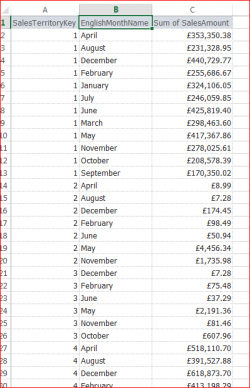
For example, instead of months going down, with one month on each row, we can pivot the column and have months across the columns. The example below shows this in action.
This screenshot shows one column for month names:
Select the column to pivot to and right-click. From the Anaplan XL menu select Pivot columnname.
You have one column for each month and a table that is much easier to read.

