A Table Filter is a selection type you can create for a hierarchy. It allows you to filter and group cube members into new aggregations, dynamically based on Excel data.
You can:
- Group members into new total members
- Easily switch views between different total types
- Filter which members are displayed in your report based on either the cube or dynamic members
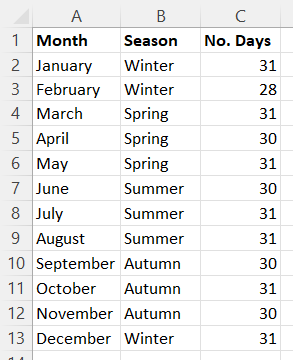
In the example below, the worksheet has cube data with the Months of the year as an existing hierarchy. You want to view the data by Season or Number of Days, but these fields aren't built into the cube.
The example below starts by creating the table in Excel with the cube members in one column and the custom attributes in other columns.
On the Advanced tab within the Edit Hierarchy window, select the Filter button. The Table Filter window opens. Select the Excel range as the data range within your table report.
The data range has all the columns of data. The Members selection column contains the cube members. The Selections option allows the filtering of data included in the table. The Column and Filter section enables you to select the Excel ranges within the table to filter by properties of a dimension.
From here, you can create a few different reports.
New total members
You can change the Selections option and pick a column in the dropdown. The members within the column are the grid selections. You can aggregate the data by properties that aren't in the cube.
Filter by property
You can use the properties of a dimension listed in your table to create a new table filter. For example, if you have a table with the Month dimension as a column and Month's properties, Season, and No. Days are also listed as columns. You can use the Column Filter section to select the Excel range within the table to filter by the properties of a dimension.
You can combine Selection columns and Filters; for example, you could show the data by season for months with 31 days.
You can filter by multiple columns at once, and pick a range of cells to multi-select the filter values.
Dynamic selections
You can use an Excel cell to control the Selection's value. Then, you can make a report where the user can easily change between the different custom properties defined. Add a cell validation dropdown to a cell, and the user can switch views.
These filter and selection types can be combined to make more complex reports if needed.

