Learn how to create business rules in Anaplan XL.
Set expenses and totals
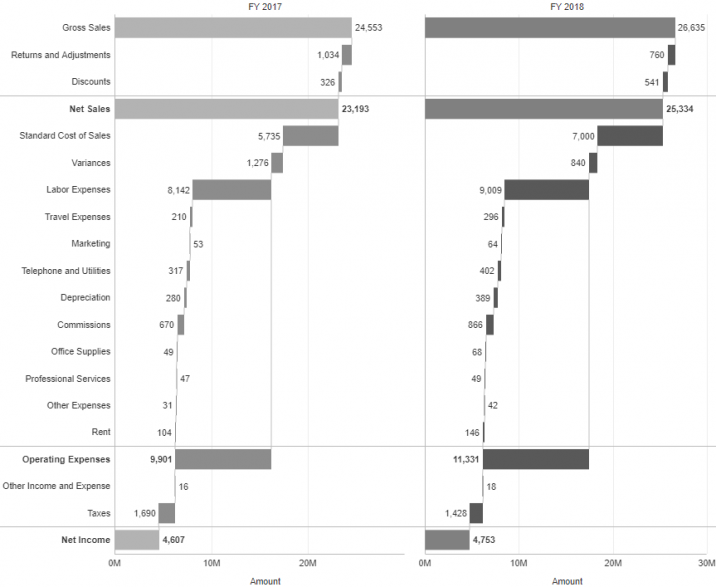
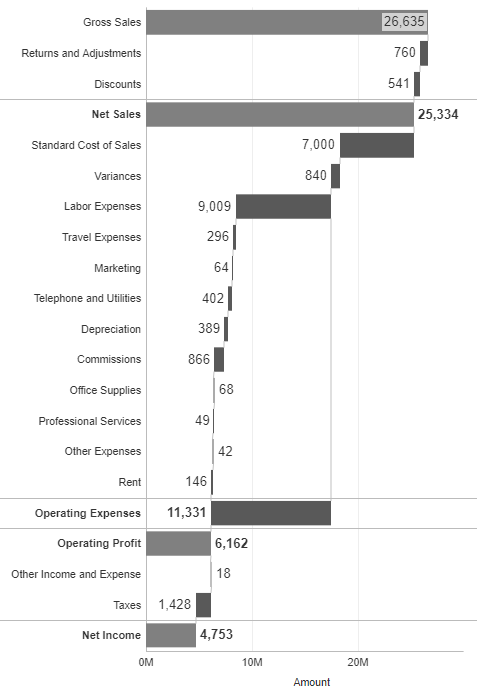
Consider the waterfall chart below. It shows the account's contributions to Net Income. However, expense accounts have a positive value in the cube and so aren't plotted in the negative direction as you would want. Members that are totals aren't being treated as such, so you are getting an incorrect total.
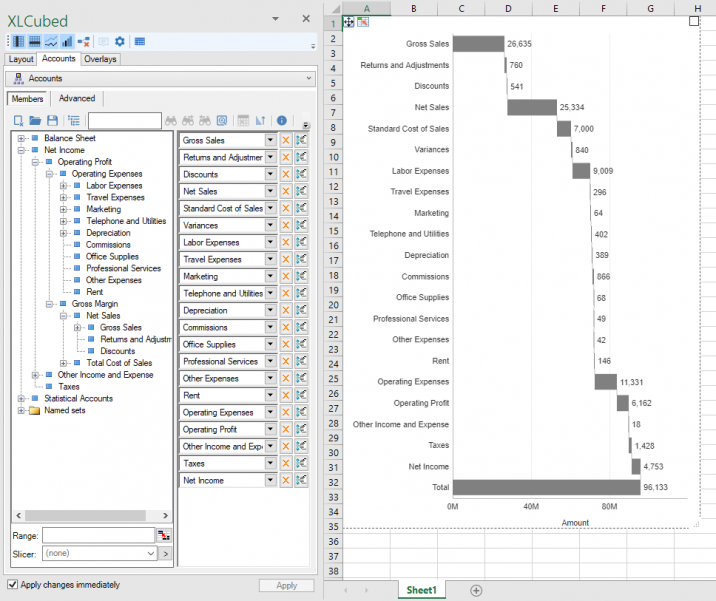
You could right-select each bar and configure whether it should be negated or a total. However, by adding business rules, this will be done automatically.
You'll start by adding rules using the inserter dialog. The rule you will create will be for expenses, which will apply to the Account hierarchy. You select all the values that have a negative contribution to Net Income. This rule will also be applied to all children of Operating Expenses, so you don't need to add those individually.
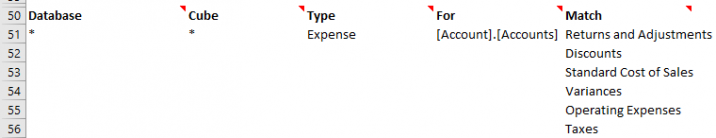
Within the Add Business Rules window, select the Connection, set Current month for Rule and Any for Applies to connections. Select the appropriate hierarchy, for example, Accounts. Select Caption for Members. Select the appropriate accounts by double-clicking:
- Returns and Adjustments
- Discounts
- Stand Cost of Sales
- Variances
- Operating Expenses
- Taxes
Select Add and the XLCubedBusinessRules sheet is added with the Expense rule.
Refreshing the chart shows that the expenses are now plotted correctly.
You now need to correct the totals. You could continue to use the inserter, or go back to the business rules sheet and add the rules shown below:
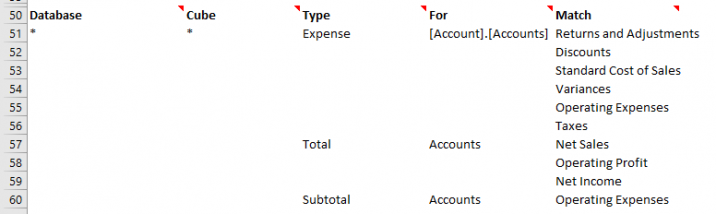
Refreshing the chart now shows the totals plotted and formatted correctly. In this example, you need to alter the subtotal count on the Operating Expenses. After this, the resulting chart in now correct.
The chart will then recognize FY 2017 as an earlier year and format it with a lighter gray fill color.