Shows actual and target values in one chart. The arrow position and color reveal the target value and direction of the variance.
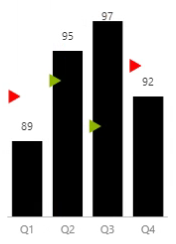
For more information, see Variance Charts.
lastModified January 13, 2025
Shows actual and target values in one chart. The arrow position and color reveal the target value and direction of the variance.
For more information, see Variance Charts.
Disclaimer
We update Anapedia content regularly to provide the most up-to-date instructions.

