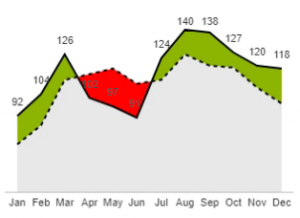
The Trend Comparison chart shows two, time series and their variance. The colors indicate the direction of the variance.
lastModified January 13, 2025
The Trend Comparison chart shows two, time series and their variance. The colors indicate the direction of the variance.
Disclaimer
We update Anapedia content regularly to provide the most up-to-date instructions.

