On-Demand Calculation enables Polaris to increase model performance by calculating values only when they are looked at by end users.
Polaris supports highly-dimensioned line items with a very large potential aggregate space. In these line items, the number of cells viewed by all users is typically only a tiny part of the entire dimensional space. With On-Demand Calculation, Polaris only calculates the parts of a line item that are necessary for what is being looked at. This results in:
- Reduced memory use: there is a reduction in the amount of memory used, as well as the reported populated cell count, for line items that can make use of On-Demand Calculation. Over time, this becomes more variable.
- Reduced latency on data changes: the time taken to recalculate because of upstream data changes can be reduced because only cells that are looked at are recalculated.
Generally, On-Demand Calculation is transparent to most users. However, model builders may be aware as they see fluctuations in the memory and populated cell count for line items where On-Demand Calculation is in effect.
Line items affected by On-Demand Calculation include:
- End-of-chain line items: These are line items with no downstream reference to them. For example, line items not referenced by any other line items.
- Line items with summary methods other than None, Formula, or Ratio.
How On-Demand Calculation happens
Polaris splits line items aggregation into regions. A region is the intersection of any unique set of aggregate levels of the different dimensions, as shown here:
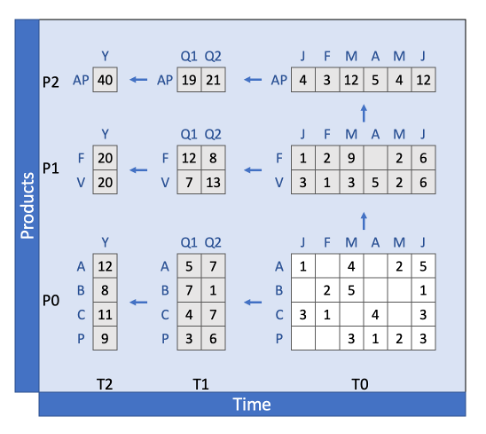
With On-Demand Calculation, if no user looks at the line item, only the leaf cells are calculated. However, if a user in a view looks at certain cells in that view, it triggers all the calculations to display the whole region.
For example, if a user looks at the top-of-the-house cell in this example (All Products and All Time), then a path of the regions needed to get to this region is calculated.
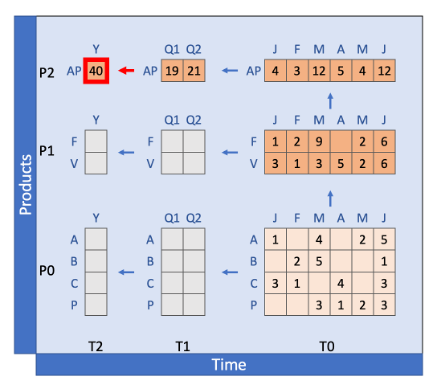
Note: As the depth of hierarchies in Dimensions increases and the number of dimensions increases, the number of regions can become significant. It is common to have many thousands of regions for a highly-dimensioned line item (even up to millions). However, only a small fraction of these are typically calculated when someone looks at the top-of-the-house.

