You can manage how hierarchy cards display.
You can expand and zoom any section of the hierarchy card on display. Select an item in the hierarchy to drill down to the underlying list item. If pagination is enabled, hierarchy levels that exceed three nodes will only display three nodes. Select Show next 5 nodes on the card to expand the chart and view more nodes.
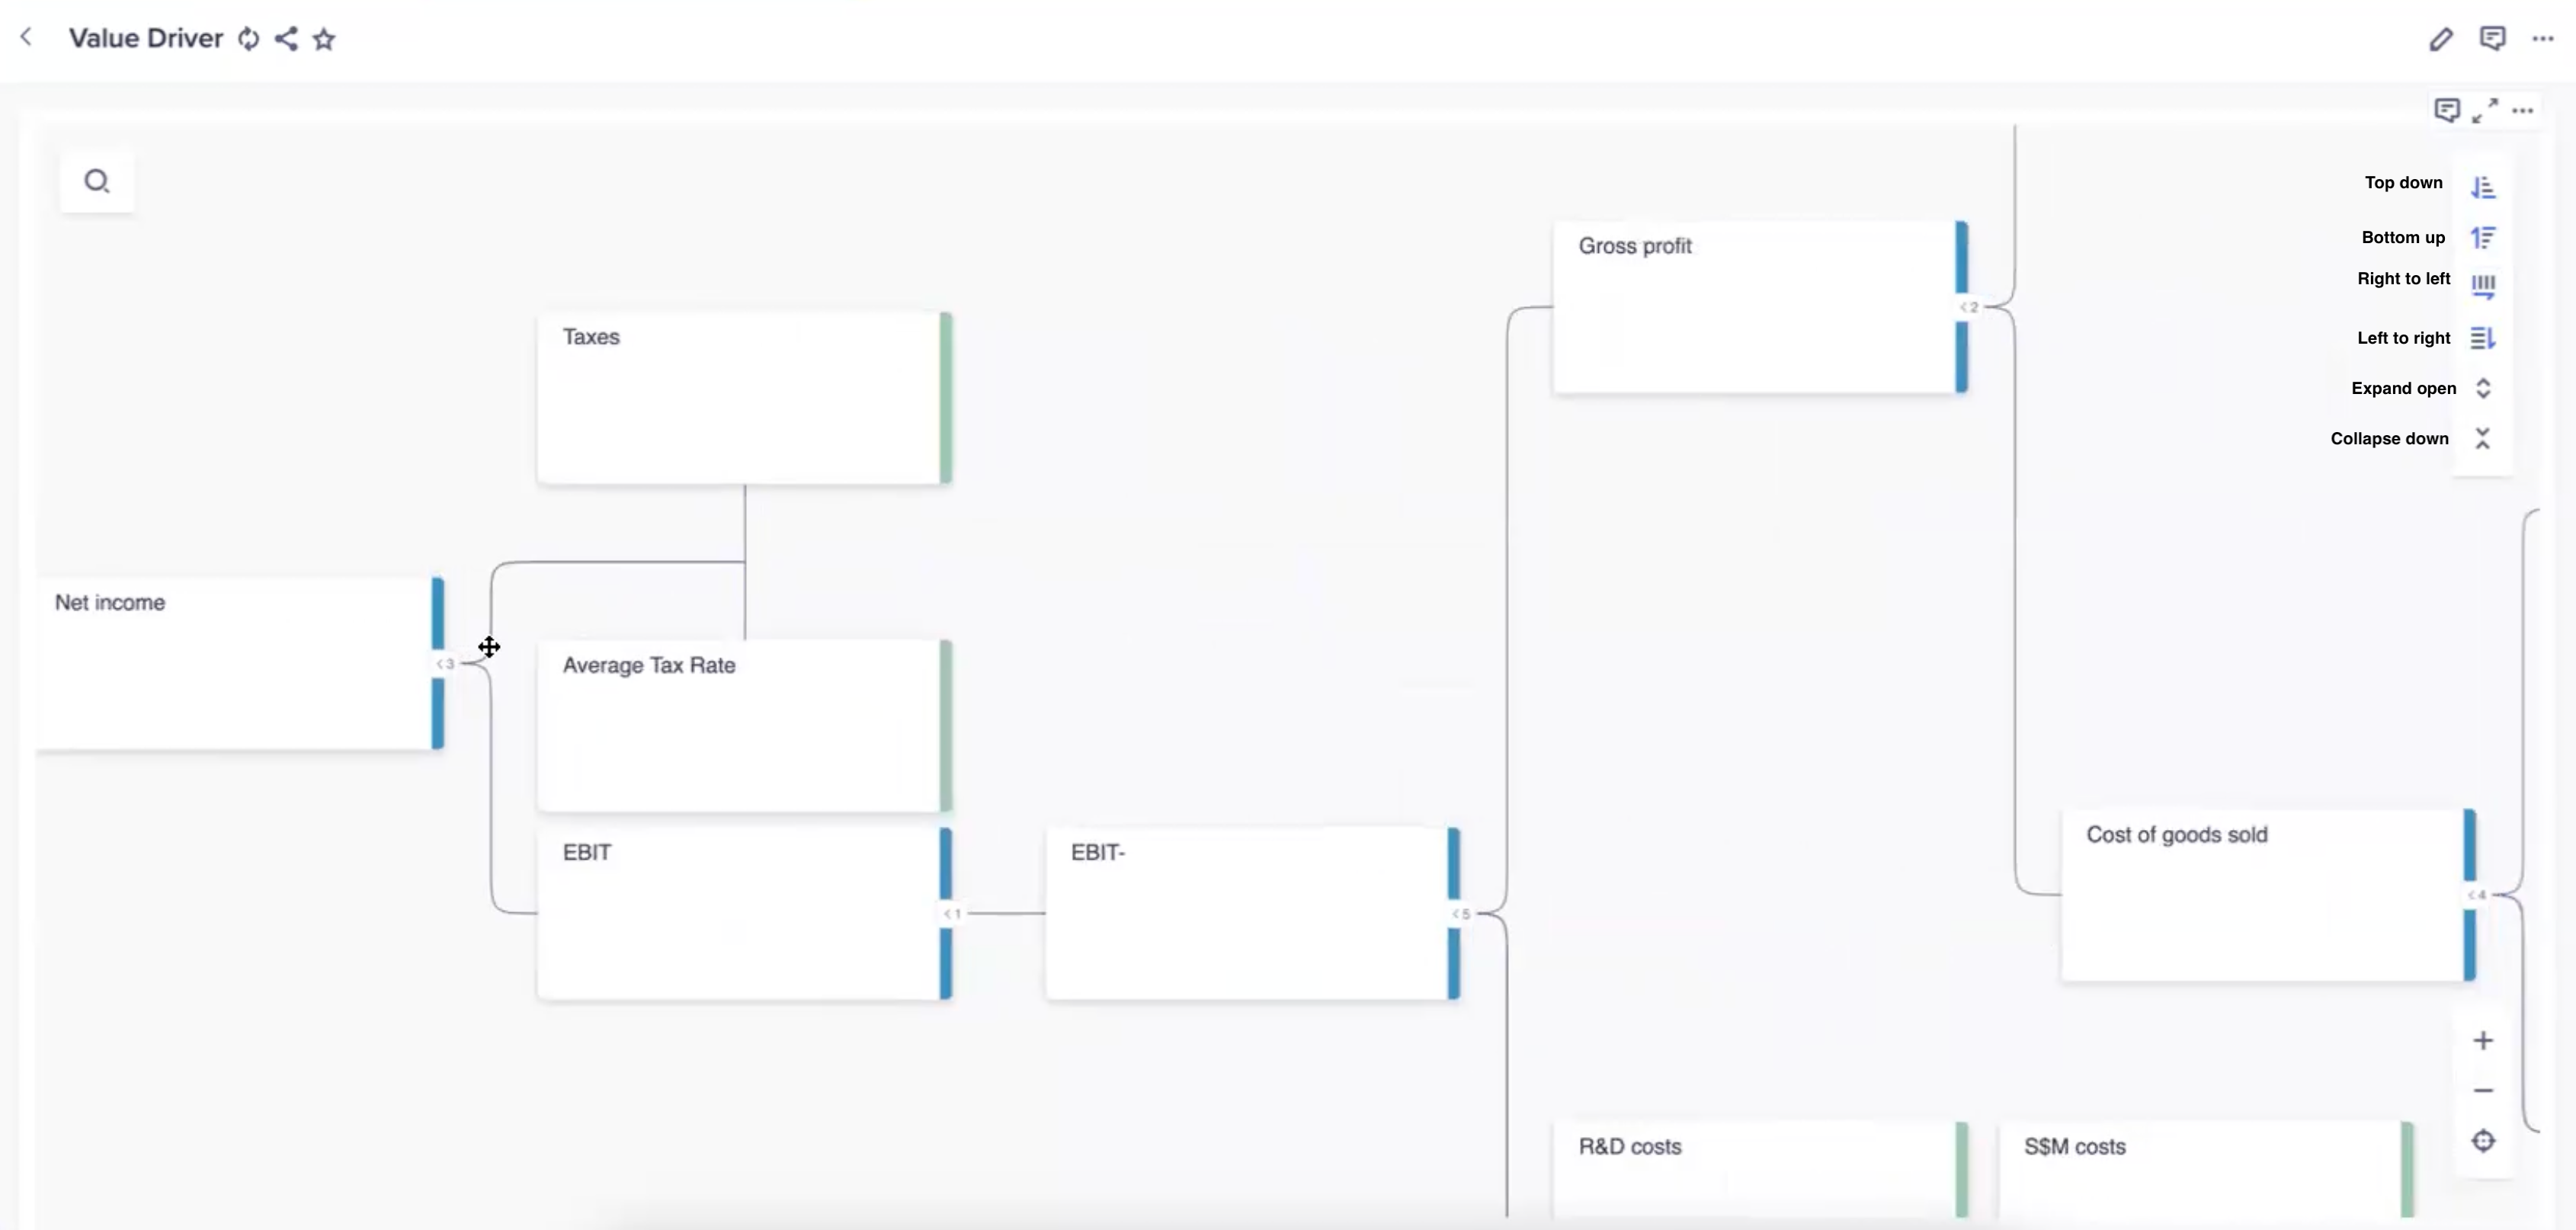
Use the menu items in the upper right corner to change your view of the card. The menu choices are:
- Top-down
- Bottom-up
- Right to left
- Left to right
- Expand
- Collapse
You can display the layout as compact or level-based. You can also expand or collapse the next row.
To filter the hierarchy chart:
- Select Filter at the upper right of the hierarchy card.
- Select Add filter + and select a line item from the dropdown menu.
- Select a condition for the line item. You can add more conditions if needed.
- Select Add filter + to add more filters, or Apply to apply them.
Select Remove all filters to clear all filters
Interactive mode
You can move nodes in your hierarchy chart via drag and drop, and immediately see the impact. If your chart is built with a:
- List hierarchy, it'll update the model hierarchy.
- Data list, it'll change the parent line item value.
You can also add and delete nodes. Page builders can enable these settings.
To update the hierarchy chart:
- Select in the hierarchy chart to enable interactive mode.
- You can then:
- Select one or more nodes and drag and drop them to a different parent node.
- Select in the node, and select Change parent, then select a new parent.
- Select to undo your changes. This option is only available for data driven hierarchies.
To add a new node, select in the node, and select Add node.
To delete a node, select in the node, and select .
Example
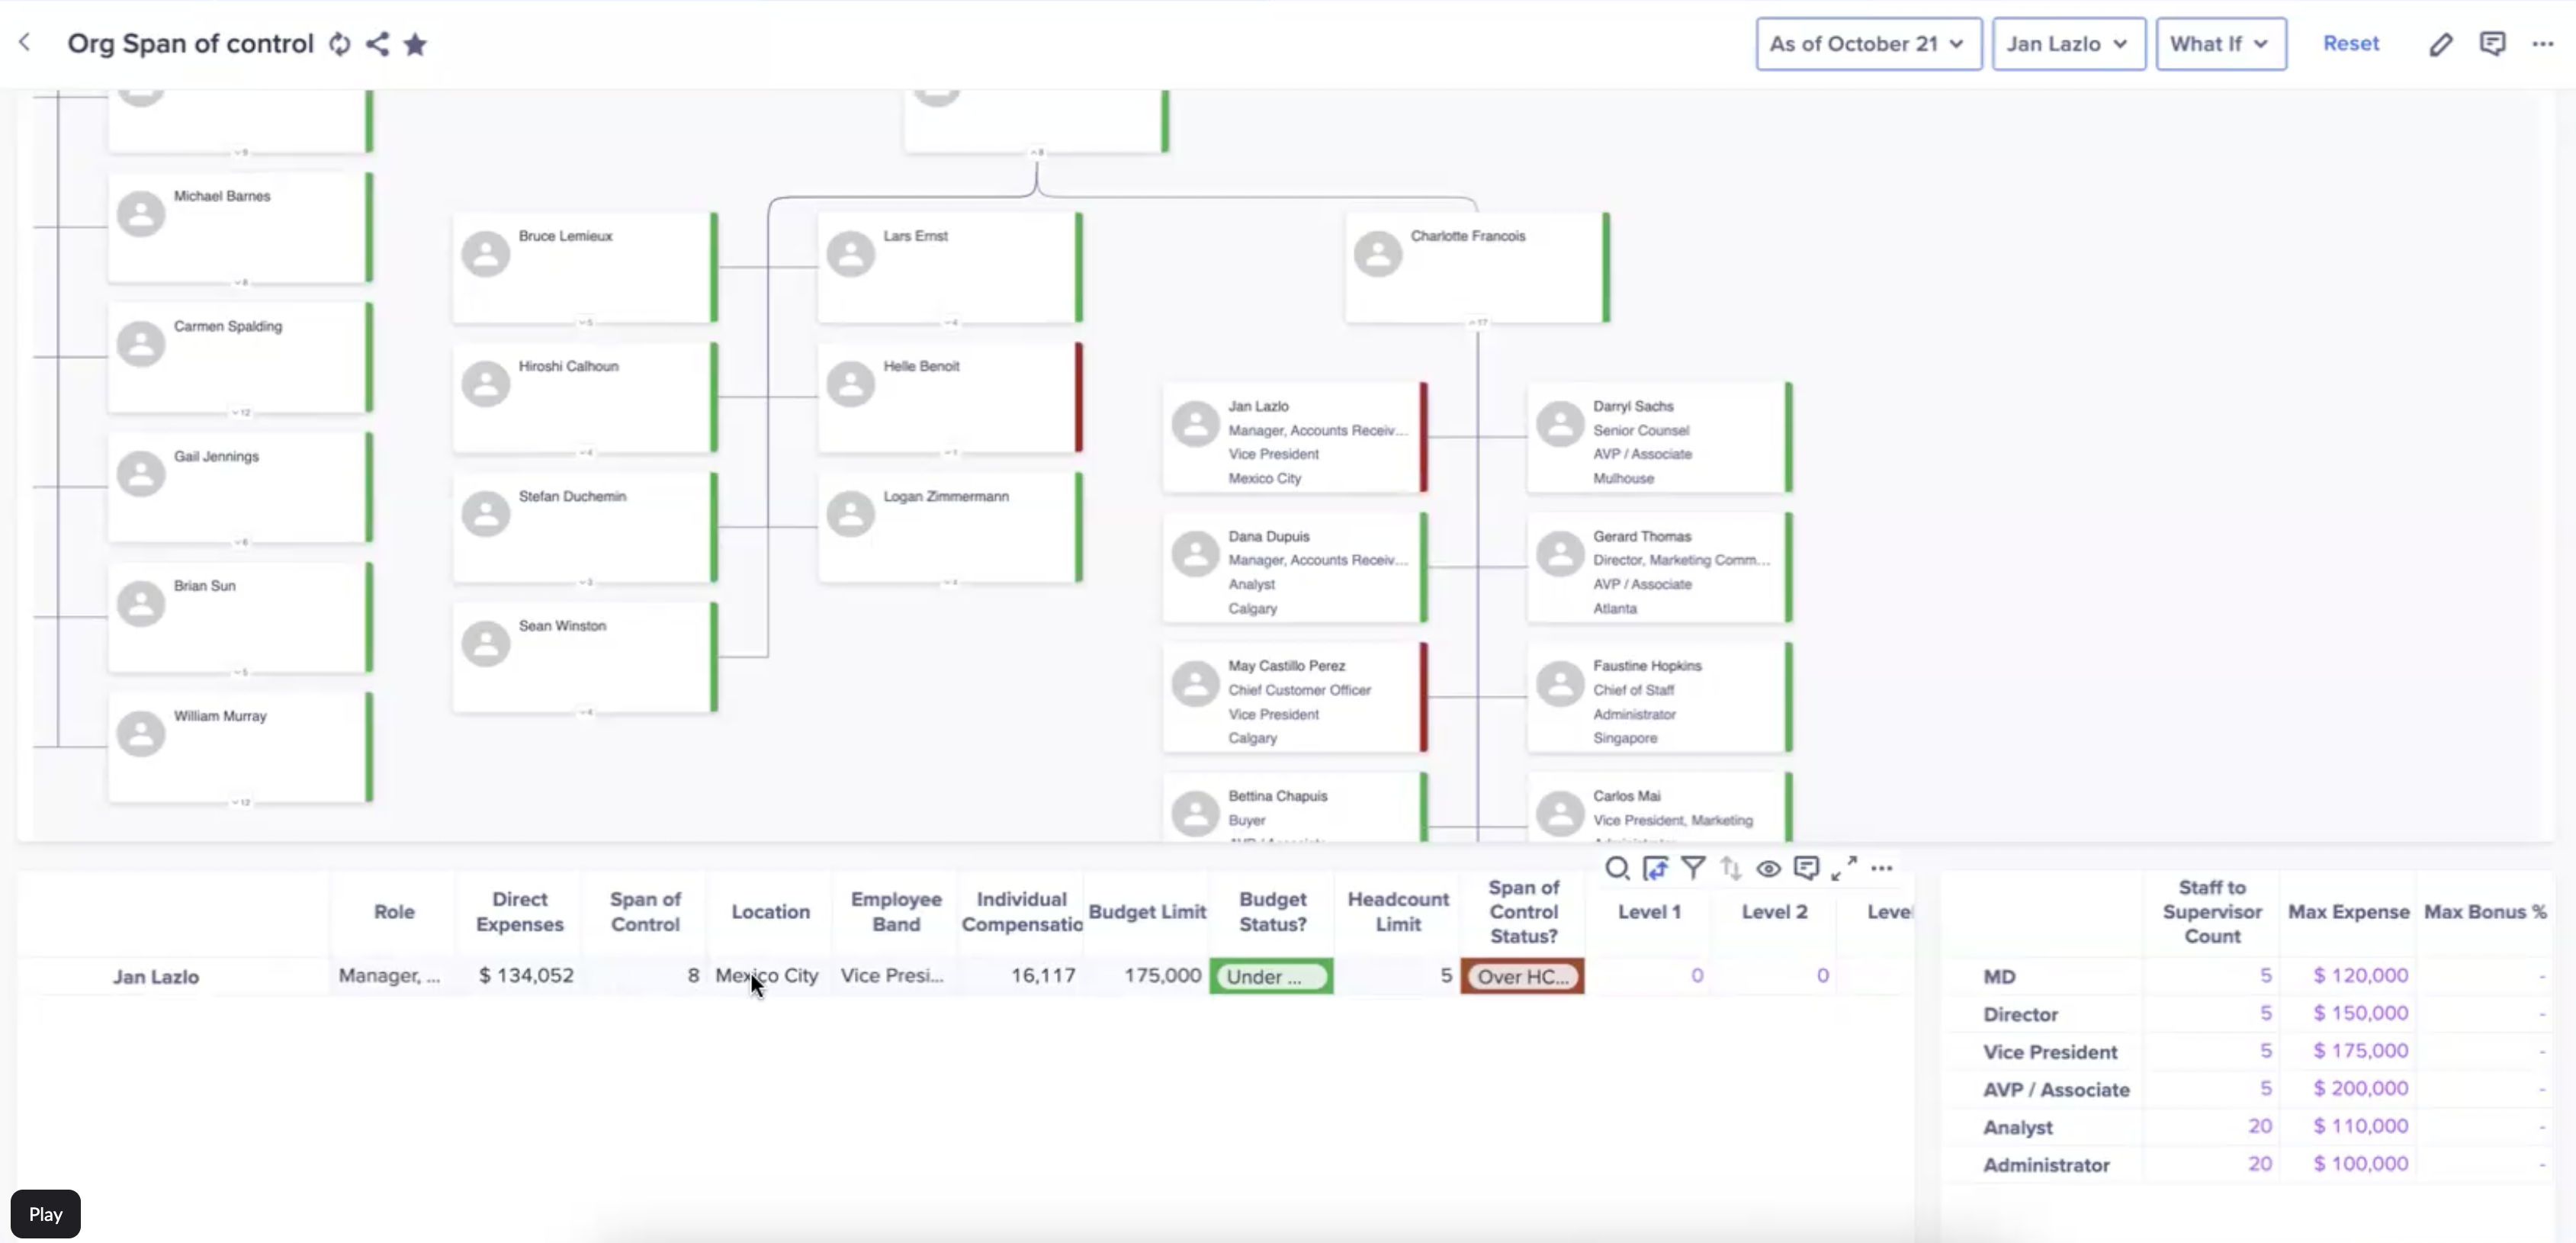
Charlotte Francois, a vice president, is selected in the example shown. She has a vice president named Jan Lazlo in her span of control. There's conditional formatting set for Span of Control Status. Jan has more than five direct reports, so the line item turns red with the warning Over HC (over headcount).
When you select a node it is highlighted and centered in the card. This selection also updates all other cards, so their context is set to be the same.
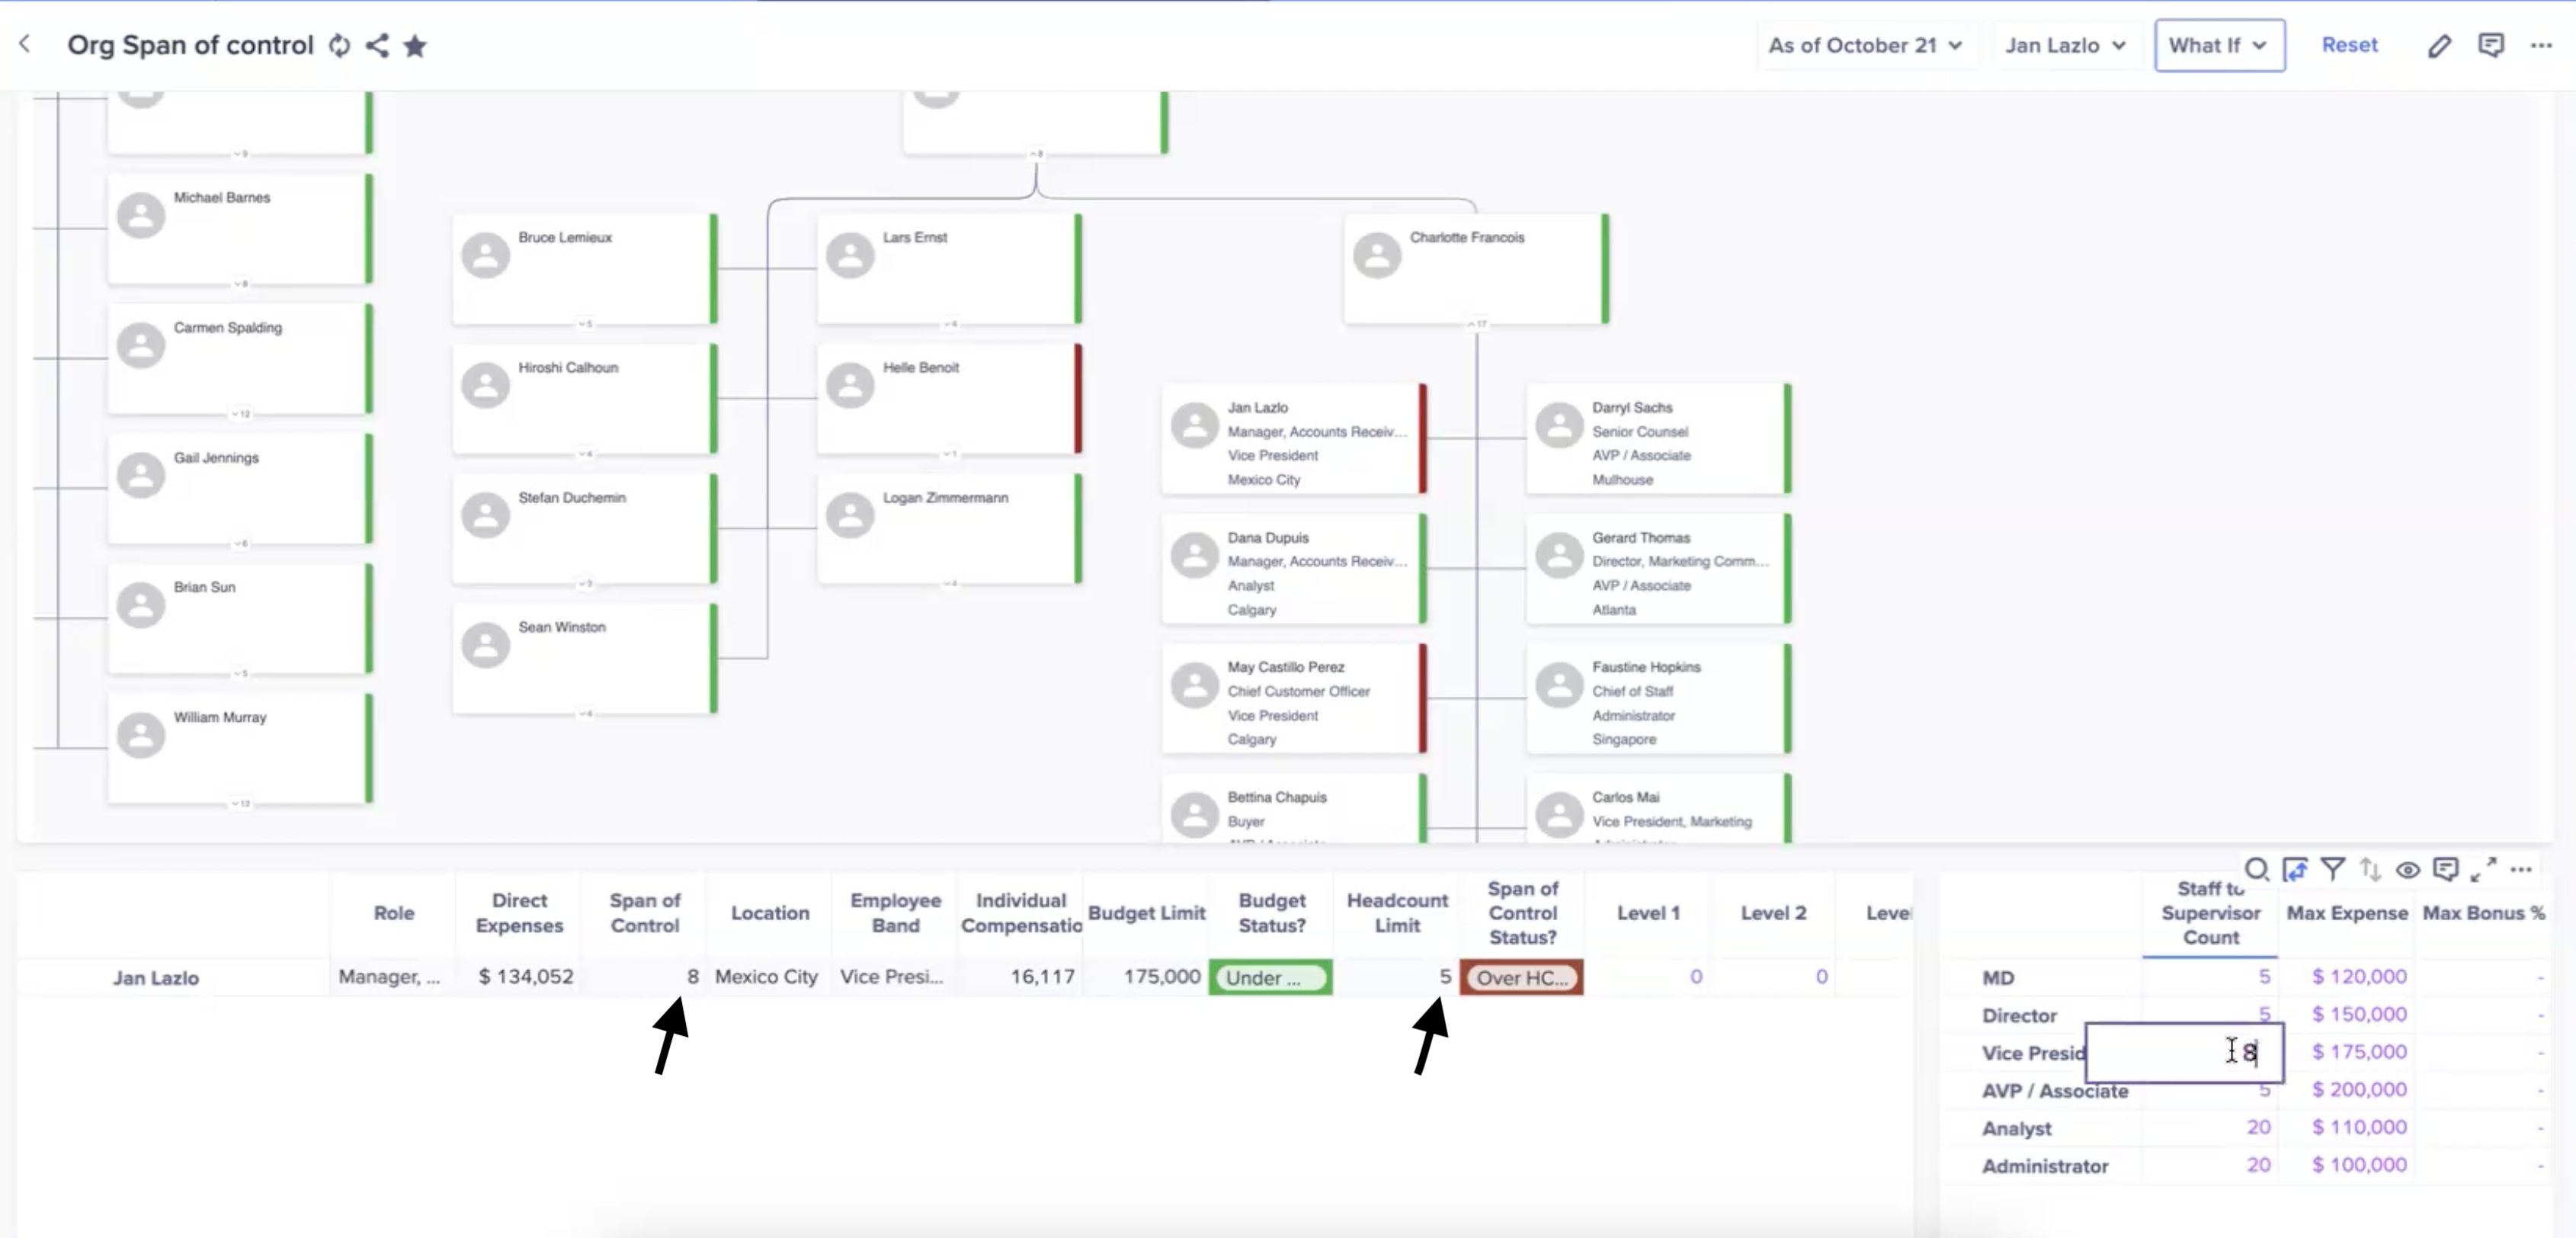
To change global parameter in this example hierarchy:
- Select a node. Here we drill down to Jan Lazlo's span of control, where the headcount limit is exceeded.
- Adjust the specific line item. Here we increase this to eight direct reports.
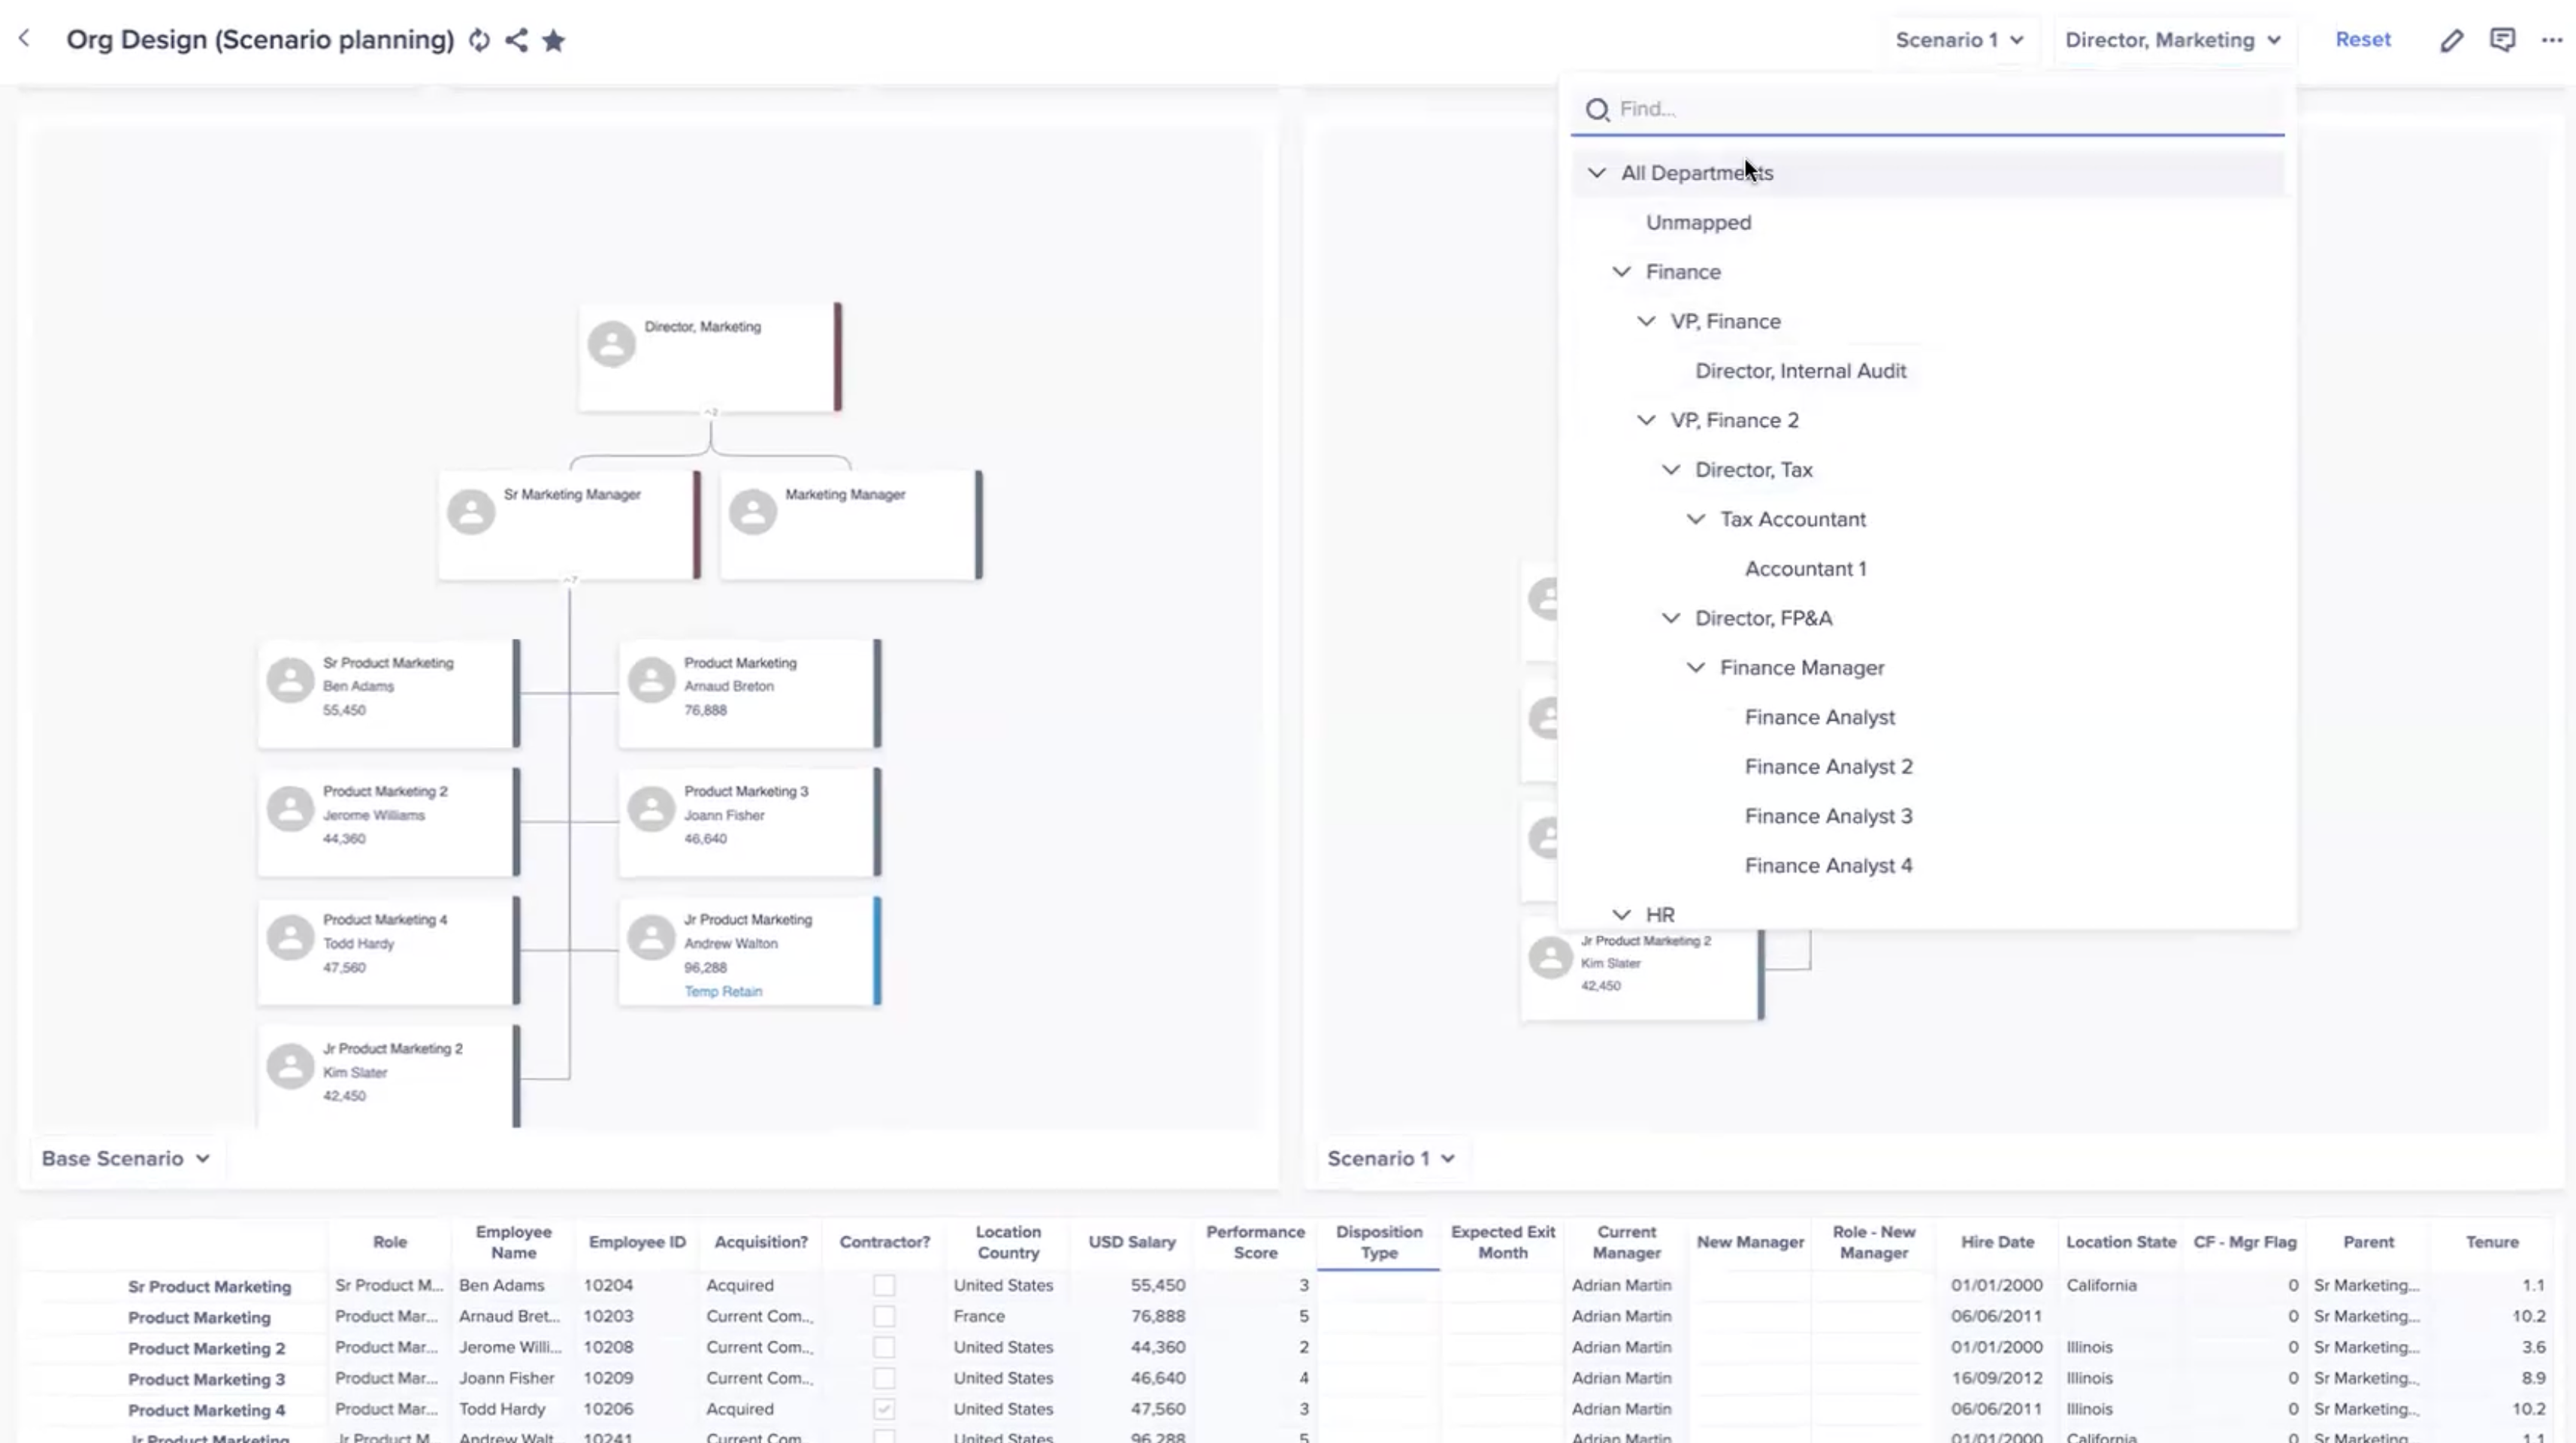
You can review organization charts side-by-side. In the example below, a director of marketing is selected. On the right panel, you can select the hierarchy filter All Departments to get a visual comparison at a glance.
You can also review and arrange value driver trees with hierarchy cards. In this example, we see Net income as the value driver and the display options in the upper-right of the screen. This example uses a left to right flow for the hierarchy.