Open the report designer to create a new report or to edit an existing grid.
To open the report designer, on the Anaplan XL Reporting ribbon, select either Grid or Formula Report. You can also open an existing grid by selecting Design Grid from the right-click menu.
Layout
The report designer has four main parts, as shown in the diagram below.
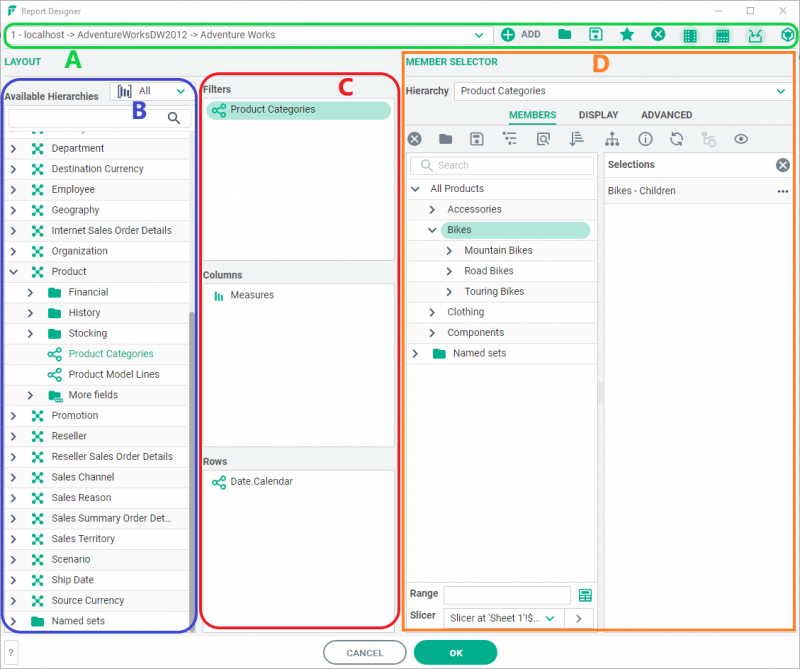
A: Toolbar
Perform various operations and set certain options on the report.
B: Available hierarchies panel
The Available hierarchies panel contains a tree that enables you to select new hierarchies from the cube. Expand the dimension to view the hierarchies which it contains. Hierarchies can be dragged from this area into Headers, Rows, or Columns to be used within the report. The different hierarchy types can be distinguished by their icon.
C: Selected hierarchies panels
Shows you what hierarchies are currently selected for the report. Select a hierarchy to show the current member selection in D.
D: Member selection panel
Shows the members selected for a hierarchy and advanced selections such as rankings and member properties.
Moving hierarchies
You can move the hierarchies by dragging and dropping them. The member selections and options for the hierarchy are maintained for the new position. You can also drag them to the Available Hierarchies panel to remove them from the report.
To choose more than one hierarchy to move, hold down the Ctrl key while you select it. You can also hold down the Shift key to choose from a range of hierarchies.
Toolbar actions
Select Open report to open a previously saved report file. You can load and save the current report as .xl3grid files, which can then be shared with other users.
Select Save report to save the current report layout as a file.
Select Add to favourites to save the current report as a favorite report. You can view, edit, and delete saved favorites in Anaplan XL > Utilities > Manage Favorites.
Select Favorites to select a previously saved favorite report.
Select Clear drills to back up any members that have been drilled down in the grid.
Select Remove empty rows to omit rows with only null values.
Select Feed hierarchy member results. Use the MDX function Generate to enable dynamic ranking and filtering. This option can be slower.
With this option turned on, any ranking on an inner dimension considers the members in the outer dimensions. For example, If you have Country and Product on rows and display the Top three Products:
- Turned on, you get a different Top Three for each country.
- Turned off, you get the values for the global Top Three, split by country.
Search
You can do a quick search on hierarchies. This is useful when your cube has many hierarchies.
Enter a string in the search box within the Design Report window.

