Anaplan XL Reporting operates within Excel. You can chart any data retrieved into the workbook using Anaplan XL using any standard Excel chart type.
Standard Excel charts
If the data being plotted is static in shape and you need very fine-grain control over the chart formatting, this is a good approach.
Anaplan XL grid charts
Anaplan XL grid charts provide a way to tie a chart directly to a grid. This helps when the grid changes in shape and number of elements. It also lets you choose the level of data to be plotted. The available chart types are a subset of the Excel Chart library.
For further information, go to Grid charts.
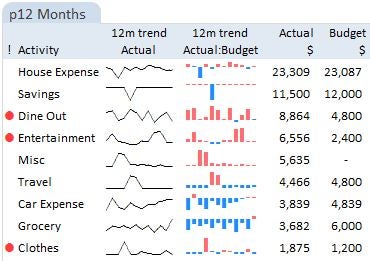
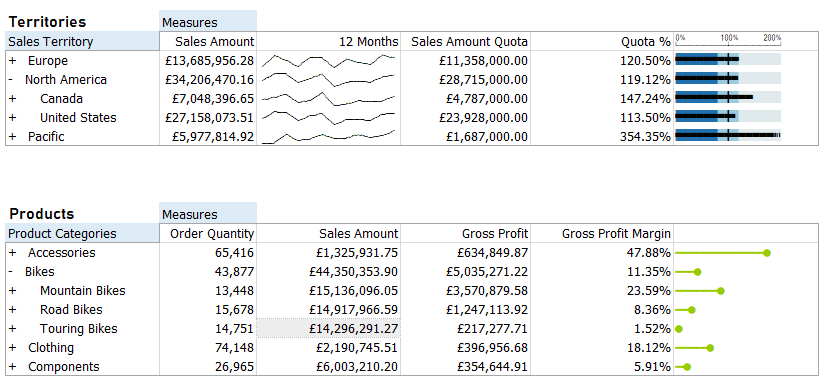
In-cell charts
In-cell charts are small, focused charts, each fitting within one Excel cell. They're designed to be used within tables of data and enable the mixing of numbers and charts together in tables. They're often a very space-efficient way to give context to or highlight outliers in a data table.
In-cell charts can be used in two ways:
- Formula-based: Where an Anaplan XL formula controls the chart, and the data being plotted must first be returned into Excel. For more information, see In-cell chart designer.
- Embedded in grids: Where the charts are generated directly as part of the grid, and support data growth. For more information, see In-cell charts in grids.
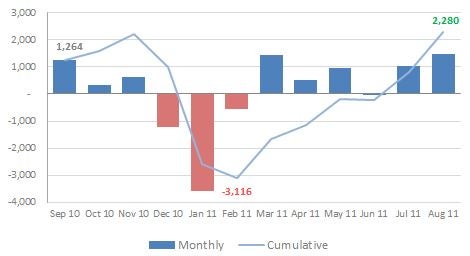
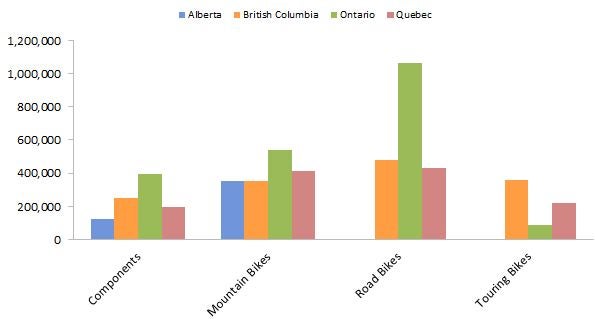
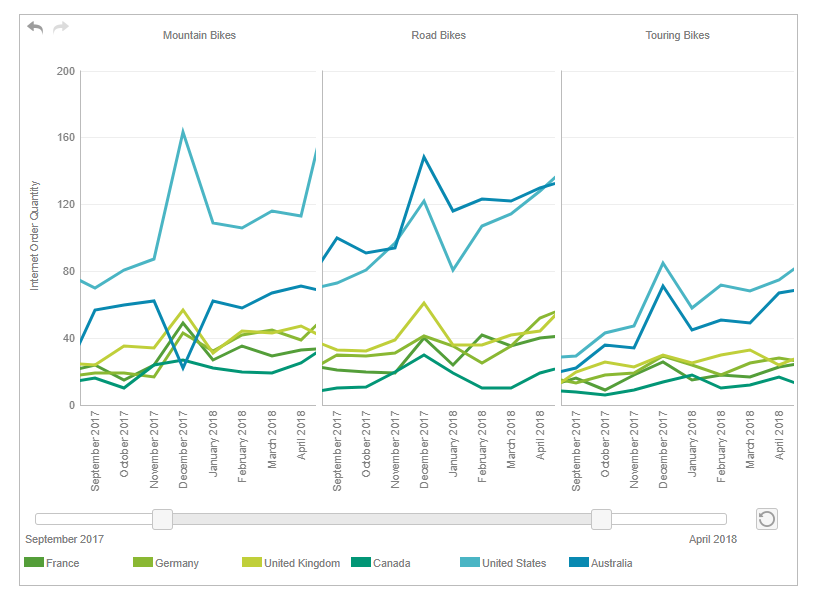
Dynamic charts
Dynamic charts, inspired by Trellis charts, are highly interactive and use individual charts to display each slice of a data set.
The axes are on a common scale, and the only variable is the data set slice being changed. They make it easy to see shared trends and patterns or outliers across the data set. For further information, review: Dynamic charts
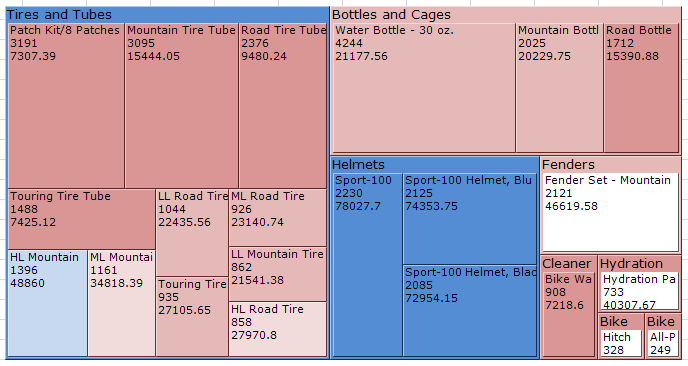
Treemaps
A treemap is a way to display hierarchical information using nested rectangles or tiles. They're most often set up where the size of the rectangle depicts one metric, and the color depicts another. They can often help identify patterns which would otherwise be difficult to see.
For further information, see Treemaps.
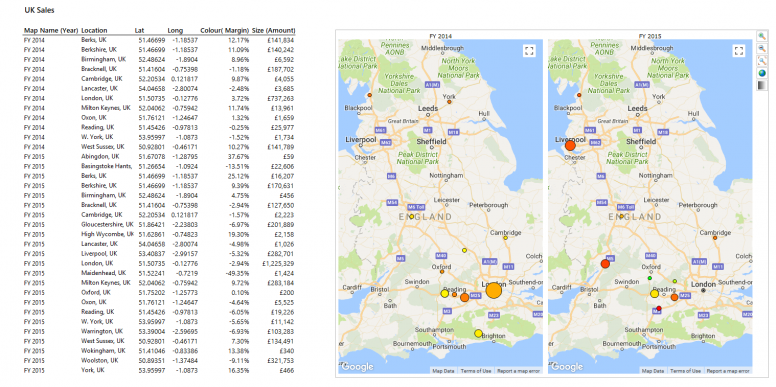
Mapping
Anaplan XL provides point and shape-based geospatial mapping. The maps can be zoomed and panned as needed and can be used as a selector for a report as well as a display.
For further information, review Maps.
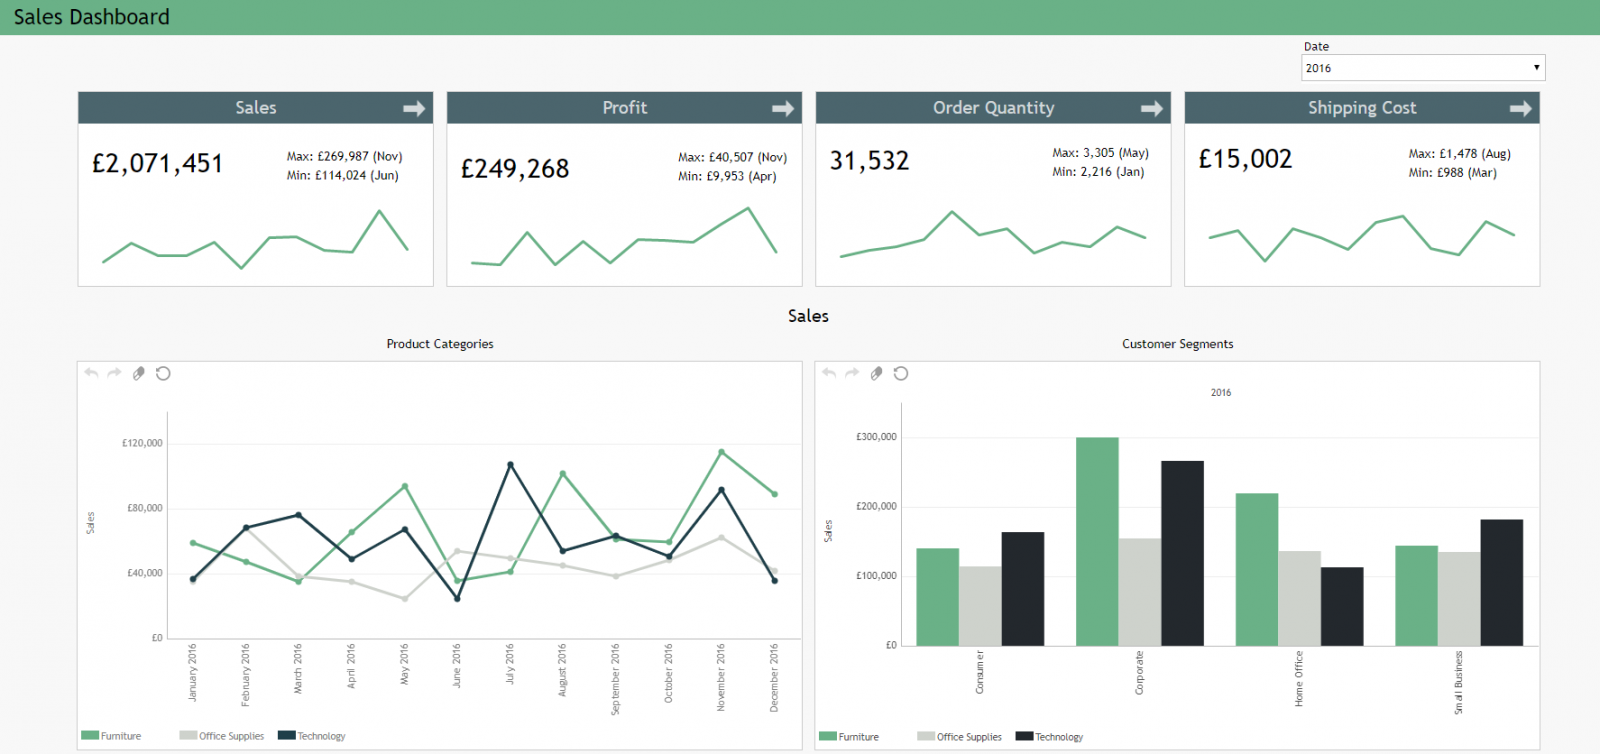
Dynamic dashboards
Anaplan XL allows you to create special sheets that are responsive to screen size. You can add any Anaplan XL component to the sheet to create highly dynamic and interactive dashboards suitable for viewing on any device.
For further information, review: Dashboard sheets.