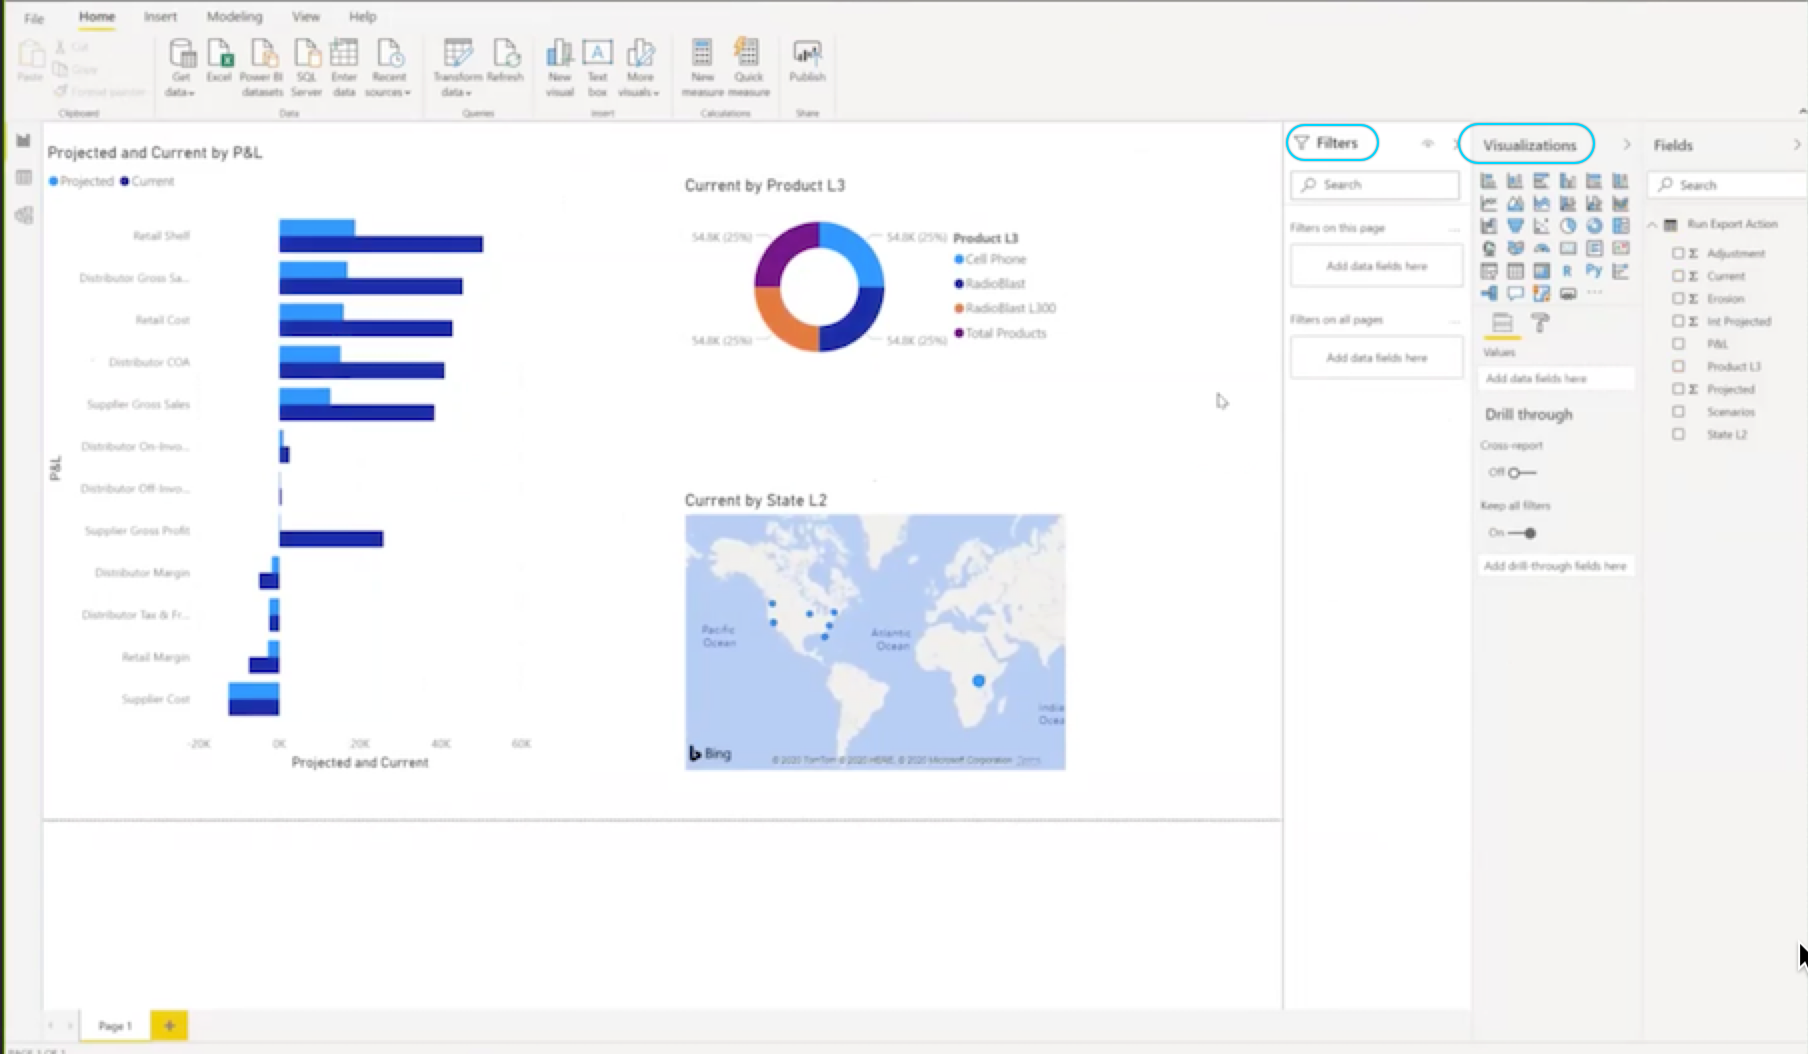
Once your data loads into the Power BI Desktop, you can perform data visualizations.
How to make the most of data visualization helps you to select Columns, apply Filters, perform Visualizations, and Publish.
lastModified May 09, 2023
Once your data loads into the Power BI Desktop, you can perform data visualizations.
How to make the most of data visualization helps you to select Columns, apply Filters, perform Visualizations, and Publish.
Disclaimer
We update Anapedia content regularly to provide the most up-to-date instructions.

