You can use a line item subset to pull line item data from different modules and view them in a single place. This example describes how to create a page that lets you select between two months, and view the variance between those months on five different items. As you select different months, the values change.
Download the Anaplan Level 1 Model Building model. This model is available when you sign up for the Level 1 Model Building course in the Anaplan Community . In Lesson 1, go to Activity: Add Example Model to Your Workspace.
Create the EMP03 Employee Expenses by Country module. It's based on EMP02 Employee Expenses, and includes the Time dimension, and the G2 Country list.
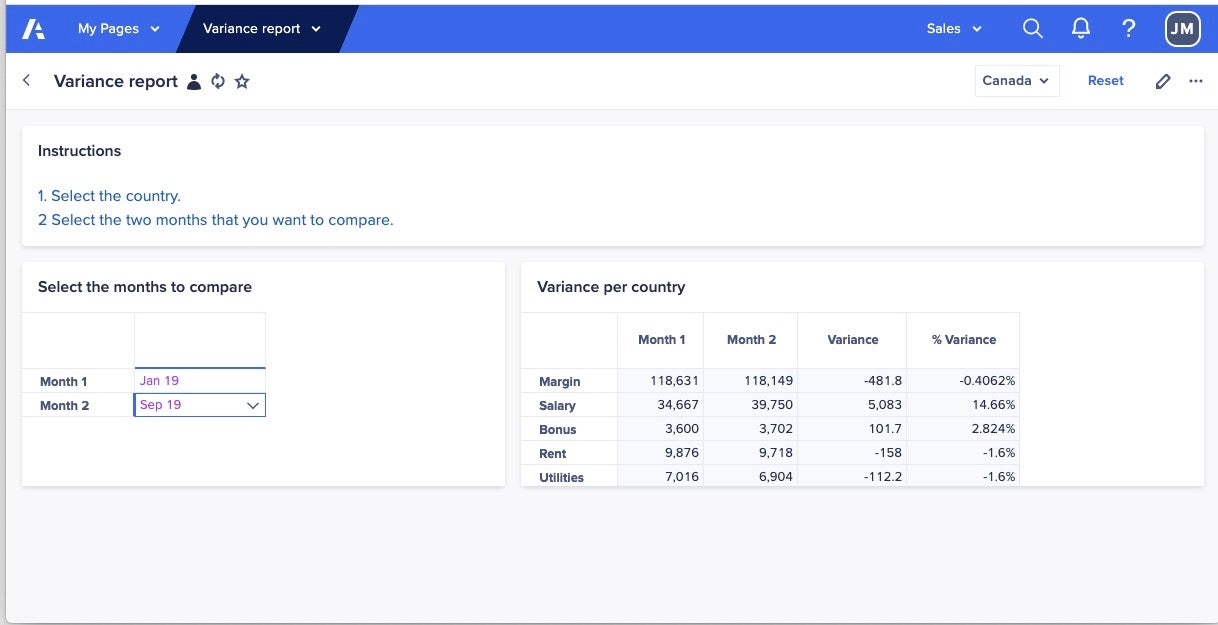
The goal is to have a board with two cards within the Anaplan User Experience. One card allows you to select which months you want to compare, and another card shows the variance per country.
To create this board:
- Create a line item subset called LIS: Multi-variance reporting that takes line items from three modules.
- Create a staging module called REP05 Variance Report Staging to pull the line item data into using the COLLECT() function.
- Create an input module called SYS11 Time Variance Reporting.
- Create a variance report module called REP06 Variance Report.
- Create a page called Variance report.
When you've created the board, you can select different months on one card, and see the variance per country reflected on the other.

