As part of the line item subset example, create a page that allows you to select between two months and view the variance between those months on five different items. As you select different months, the values change.
Note: See Line item subset example for the complete list of steps.
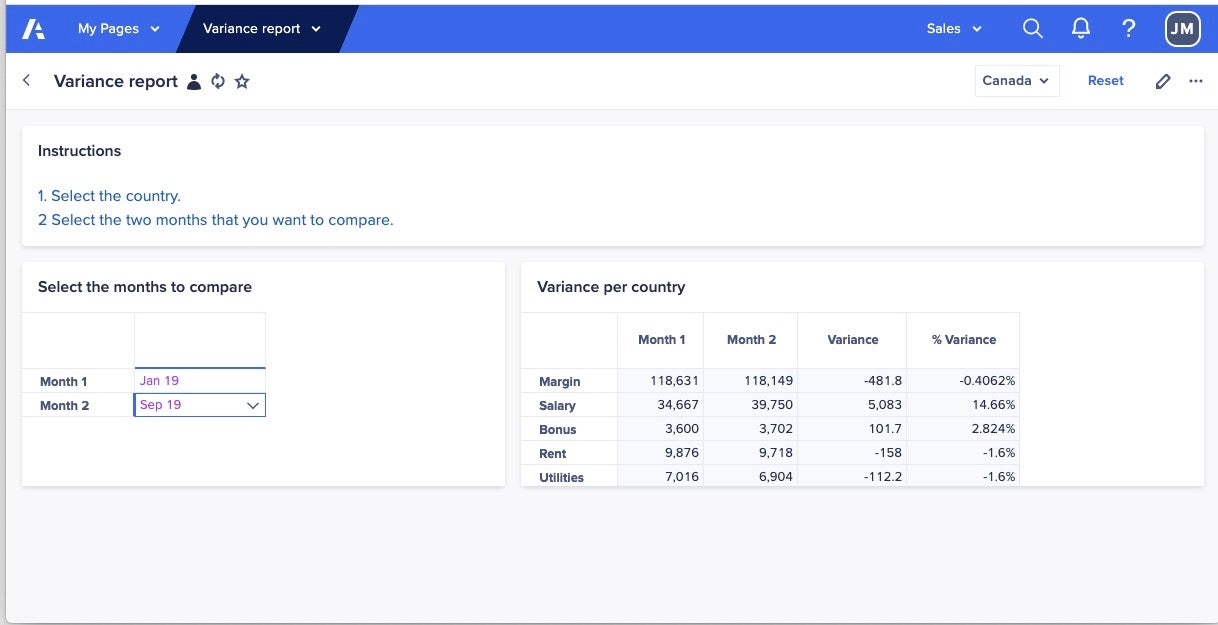
The goal is to have a page with two cards. One card allows you to select which months you want to compare, and another card shows the variance per country.
- Create a page that uses a board.
- Name the page Variance report, and select the workspace and model that contains the modules you created for the Line item subset example.
- Add a grid card to the board and configure the card:
- To display the SYS11 Time Variance Reporting module.
- Give it a title such as Select the months to compare.
- Select Grid and turn on Allow editing.
- Add a second grid card to the board and configure it:
- To display the REP06 Variance Report.
- Select Pivot , drag Line items onto Columns, and the line item subset LIS Multi-variance reporting onto Rows. Select Update.
- Give it a title such as Variance per country.
- Select Cog for All Regions and select Show/Hide. Ensure that the G2 Country level is selected and select Apply.
- To test the Variance report, select Publish. In the Select months to compare card, select two different months and see the values change in the Variance per country card.
You can configure the page in different ways. In the example shown, the Users list is hidden on both cards, but you could choose to show it. There's also a text card with instructions.

